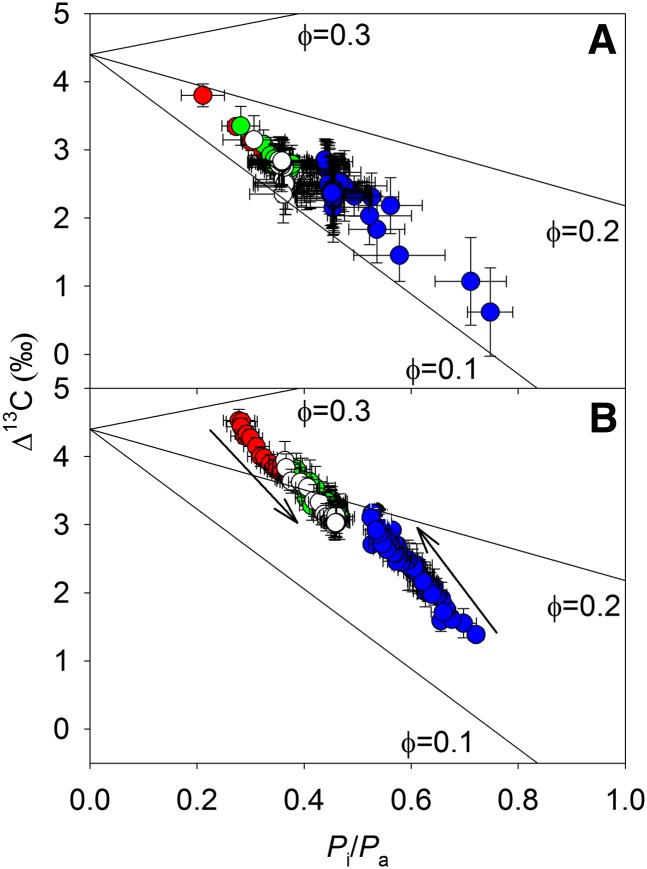
Figure 2.
Δ13C (‰) as a function of Pi/Pa (unitless) for RGB (white circles), red (red circles), green (green circles), and blue (blue circles) light in maize (A) and M. giganteus (B). Solid lines were modeled (Eq. 7) with ϕ of 0.1, 0.2, and 0.3 from bottom to top. Arrows indicate the convergence of ϕ to a constant value in M. giganteus after switching from one light species to another. Data are reported as means ± se (n = 4).

