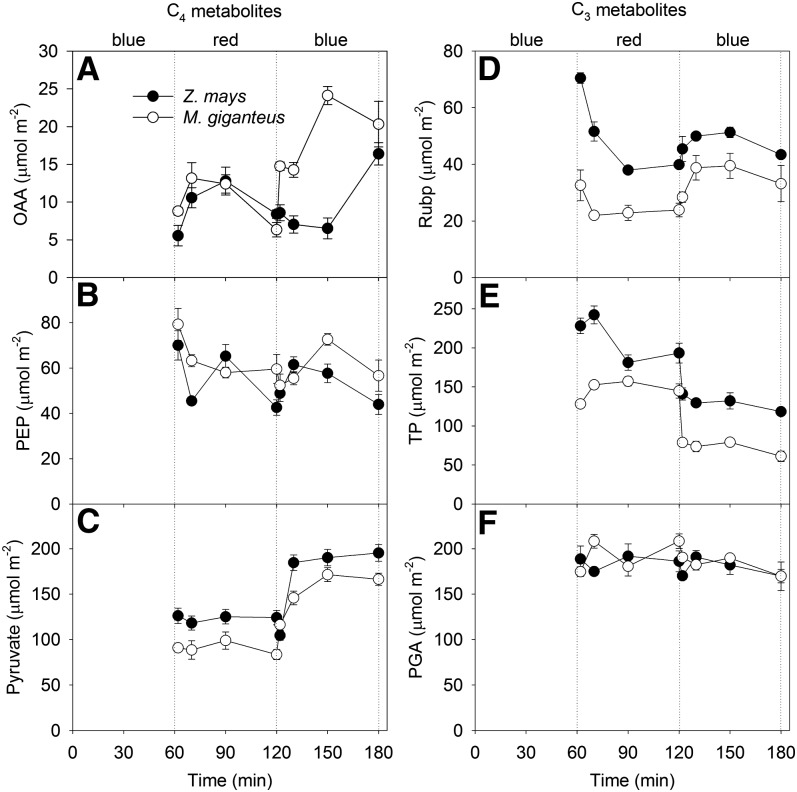
Figure 5.
Transitional variation in pools of the C4 metabolites OAA (µmol m−2; A), pyruvate (µmol m−2; B), and PEP (µmol m−2; C) and the C3 metabolites TP (µmol m−2; D), RuBP (µmol m−2; E), and PGA (µmol m−2; F) in maize and M. giganteus when light was switched in the sequence blue, red, and blue at a light intensity of 900 µmol quanta m−2 s−1. Data are reported as means ± se (n = 4).

