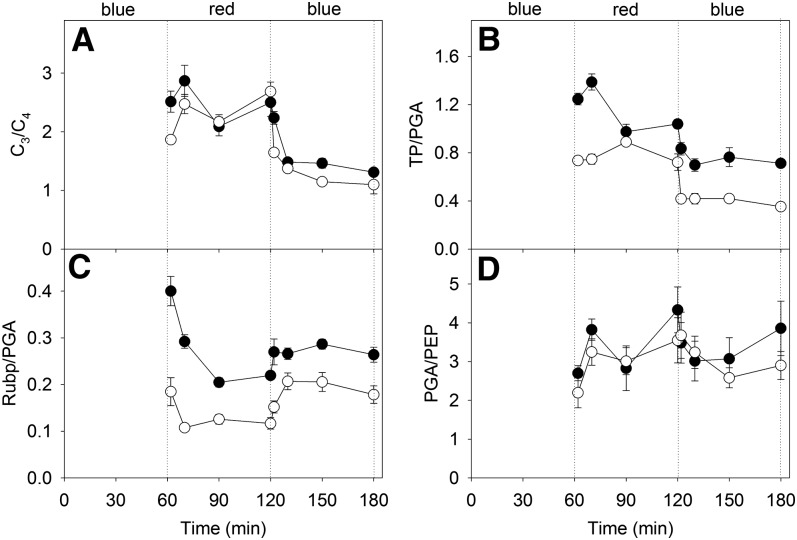
Figure 6.
Transitional variation in the ratios of C3 metabolites (TP + RuBP + PGA) over C4 metabolites (OAA + PEP + pyruvate; A), TP over PGA (B), RuBP over PGA (C), and PEP over PGA (D) in maize (black circles) and M. giganteus (white circles) when light quality was switched in the sequence blue, red, and blue at a light intensity of 900 µmol quanta m−2 s−1. Data are reported as means ± se (n = 4).

