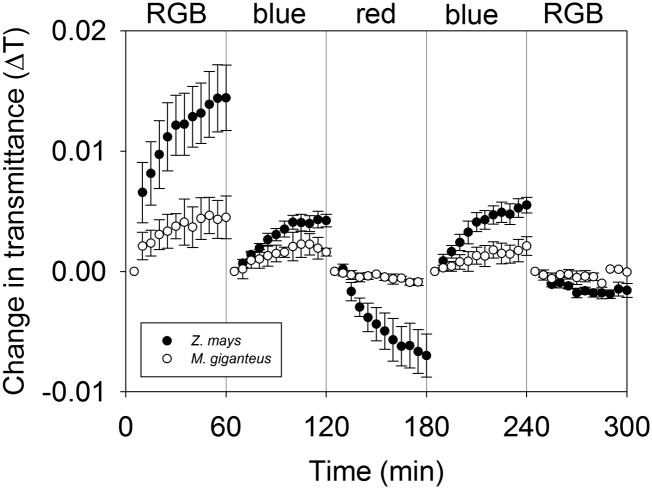
Figure 7.
Transitional variation in ΔT in maize (black circles) and M. giganteus (white circles) when light treatment was switched in the sequence of RGB, blue, red, blue, and RGB. ΔT is defined as the difference between the initial averaged 5 min of transmittance of a given light quality and the transmittance at a given time point within the 60-min exposure. Data are reported as means ± se (n = 4 for maize; n = 3 for M. giganteus).

