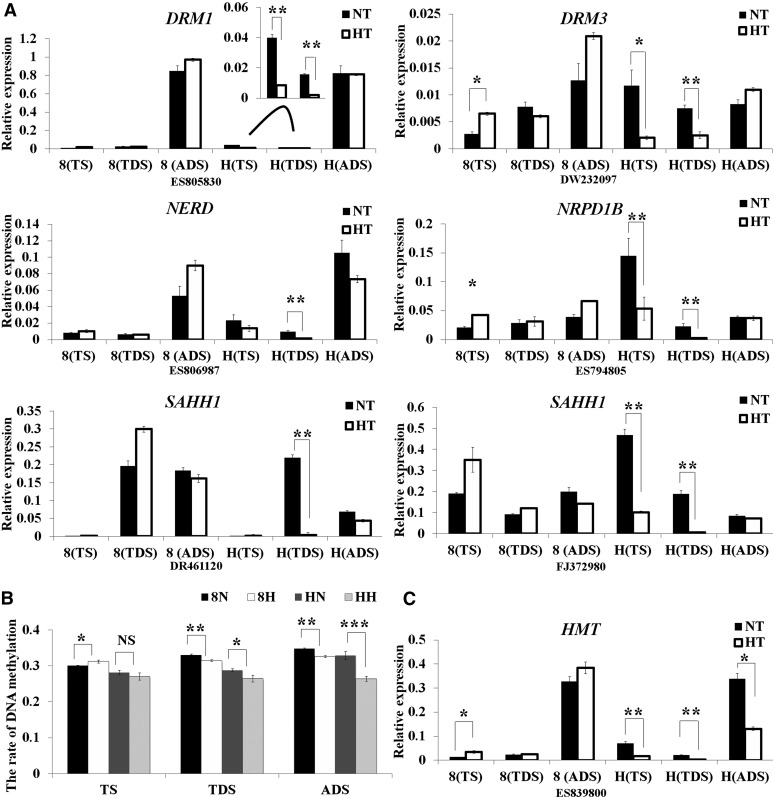
Figure 3.
Expression profiles of genes in the DNA methylation pathway. A, The expression levels of DNA methylation-related genes identified by RNA-seq were validated by qRT-PCR in 84021 and H05 under two conditions. The black and white columns refer to NT and HT conditions, respectively. 8 and H indicate 84021 and H05, respectively. B, Quantification of the genome-wide total DNA methylation level via HPLC during three anther development stages. The y axis represents the rate of DNA methylation. 8N and 8H refer to 84021 under NT and HT conditions, respectively; HN and HH refer to H05 under NT and HT conditions, respectively. C, The expression of HMT was validated by qRT-PCR in 84021 and H05 under two conditions. Data are presented as means ± se from three biologically independent experiments. Asterisks indicate statistically significant differences (*P < 0.05, **P < 0.01, ***P < 0.001) by Student’s t test. NS, Not significant.

