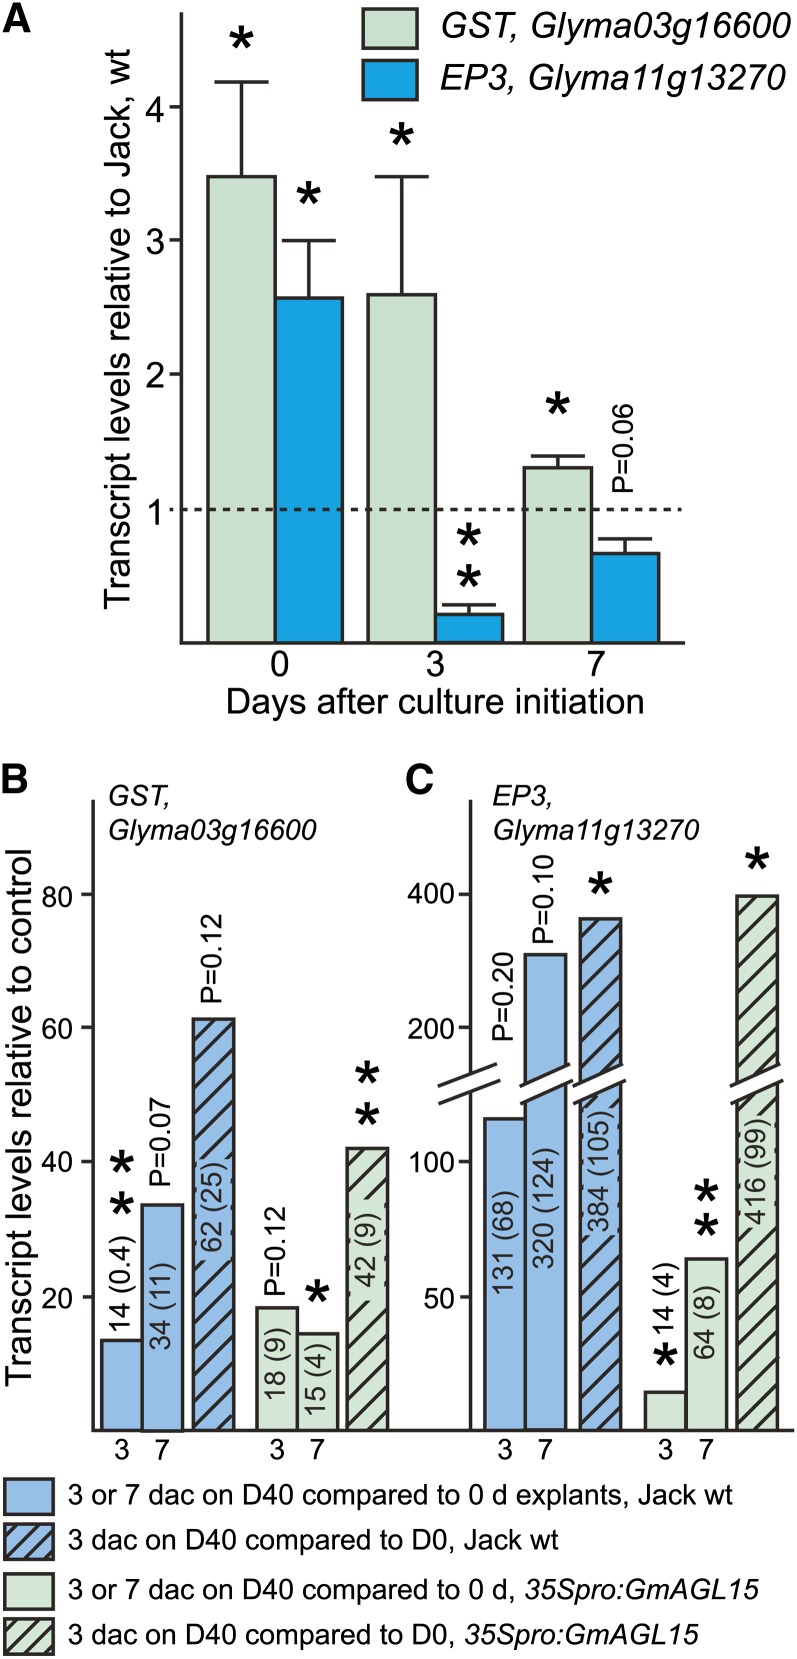
Figure 8.
Assessment of the response of the GST and EP3 genes to GmAGL15 and 2,4-D. A, Transcript accumulation from select genes associated with somatic embryogenesis in 35Spro:GmAGL15 compared with cv Jack wild type during culture. B and C, Transcript accumulation in response to time in culture on D40 medium comparing 3 and 7 dac with the 0-dac explants for cv Jack and 35Spro:GmAGL15 for the GST (B) and EP3 (C) genes. The hatched bars compare transcript from tissue cultured 3 dac on D40 medium with tissue cultured 3 dac on D0 medium (same as D40 but without 2,4-D). Means and (se) from three to four biological replicates are shown. Asterisks indicate significant differences at *P < 0.05 and **P < 0.01. [See online article for color version of this figure.]

