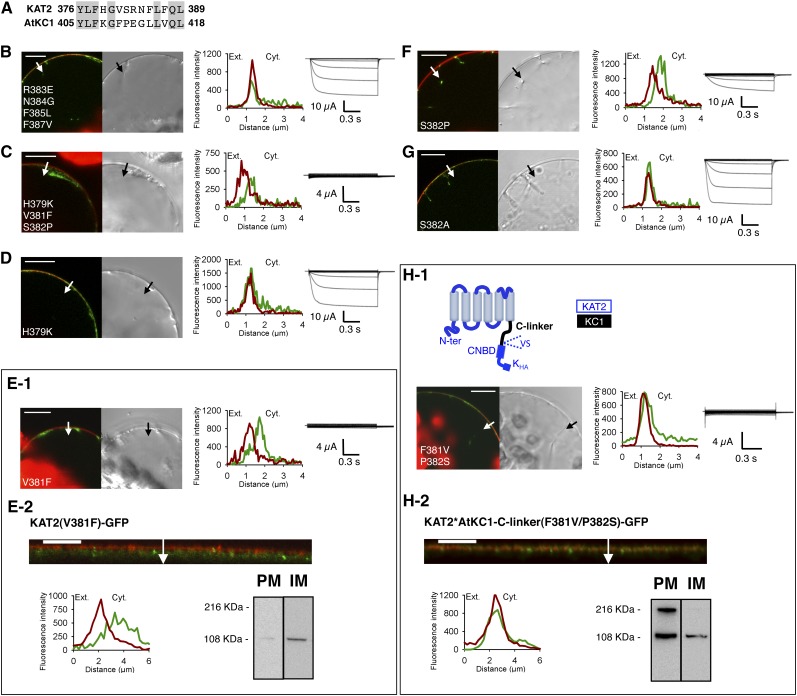
Figure 3.
Point mutations V381F and S382P in the KAT2 C-linker result in impaired surface expression of KAT2. A, Alignment of the amino acid stretch 376 to 389 of KAT2 (identified as involved in KAT2 trafficking; Fig. 2) with the corresponding stretch (amino acids 405–418) of AtKC1. Gray background denotes identical residues. B to G, Search for amino acids of the KAT2 C-linker region affecting KAT2 channel surface expression when substituted by the amino acids at the corresponding positions in the AtKC1 C-linker. Amino acid substitution was carried out by site-directed mutagenesis based on the sequence alignments shown in A. Six KAT2 mutants were obtained: KAT2(R383E/N384G/F385L/F387V) (B), KAT2(H379K/V381F/S382P) (C), KAT2(H379K) (D), KAT2(V381F) (E), KAT2(S382P) (F), and KAT2(S382A) (G). H, Introduction of the two mutations F381V and P382S in the channel chimera KAT2*AtKC1-C-linker in order to replace the AtKC1 Phe and Pro residues by the KAT2 corresponding residues Val and Ser leads to the PM localization of the mutated chimera. A pictogram describing the mutated chimera, named KAT2*AtKC1-C-linker(F381V/P382S), is provided at the top of H1 (with sequences from KAT2 and AtKC1 in blue and sequence from AtKC1 in black). In B to D, E1, F, G, and H1, surface expression and activity at the PM of mutated channels were investigated by subcellular localization of GFP fusions in tobacco protoplasts and current recordings in X. laevis oocytes, as described in the legend to Figure 1. A white arrow on the confocal image marks the position of the analyzed section crossing the PM and pockets of cytoplasm. Bars = 10 μm. In E2 and H2, further analyses were performed in oocytes expressing KAT2(V381F) and KAT2*AtKC1-C-linker(F381V/P382S) fused to GFP to check their subcellular localization by confocal imaging and protein gel-blot analysis of cellular fractions, as described in the legend to the Figure 1. A white arrow on the confocal image marks the position of the analyzed section crossing the PM and pockets of cytoplasm. Bars = 10 μm.

