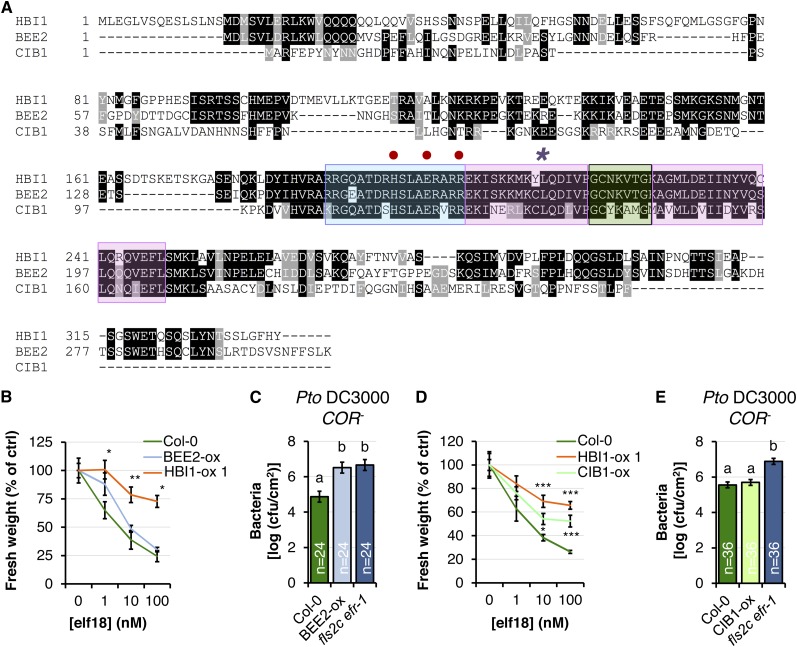
Figure 4.
Overexpression of the HBI1 homologs BEE2 and CIB1 partially inhibits immunity. A, Multiple alignment of HBI1 and the two closest homologs, BEE2 and CIB1. Blue, pink, and green colors indicate the basic domain, helices, and the loop region of the bHLH domain, respectively. B, Seedling growth inhibition triggered by elf18. Fresh weights of 2-week-old seedlings were measured 1 week after the addition of elf18. Values are represented relative to the untreated plants. Results are averages ± 2× se (n = 6). One-way ANOVA/Holm-Sidak: **P < 0.01, *P < 0.05. C, Spray infection (inoculum, 107 colony-forming units [cfu] mL−1) of 4-week old plants with Pto DC3000 COR−. Bacterial populations were quantified as colony-forming units cm−2 at 3 d post inoculation. Results are averages ± 2× se across two independent experiments (n = 24). Two-way ANOVA/Holm-Sidak: a≠bP < 0.002. D, Seedling growth inhibition triggered by elf18, as in B. Results are averages ± 2× se (n = 6). One-way ANOVA/Holm-Sidak: ***P < 0.00, *P < 0.05. E, Spray infection (inoculum, 107 colony-forming units mL−1) of 4-week-old plants with Pto DC3000 COR− as in C. Results are averages ± 2× se across three independent experiments. Two-way ANOVA/Holm-Sidak: a≠bP < 0.001. All experiments were repeated at least twice with similar results.

