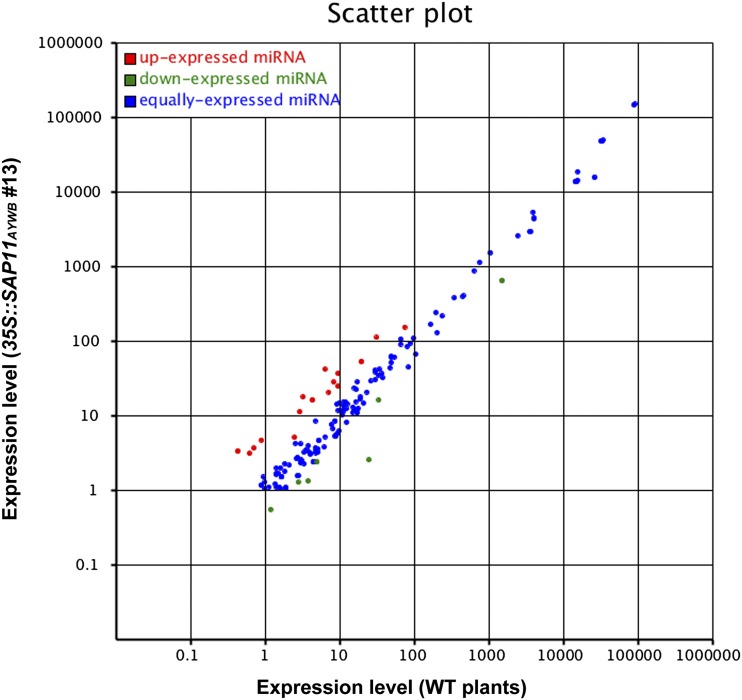
Figure 5.
Comparison of miRNA expression profiles. Scatter plot shows the related expression levels of known miRNAs in Arabidopsis wild-type (WT) plants (x axis) and 35S::SAP11AYWB transgenic line number 13 (y axis), in which the scales indicate the expression intensity of normalized miRNAs. Red points refer to miRNAs whose expression levels were 2-fold higher in 35S::SAP11AYWB transgenic line number 13 as compared with wild-type plants. Green points refer to miRNAs whose expression levels were 2-fold lower in 35S::SAP11AYWB transgenic line number 13 as compared with wild-type plants. Blue points refer to miRNAs whose expression levels were not higher or lower than 2-fold in the 35S::SAP11AYWB transgenic line number 13 as compared with wild-type plants.

