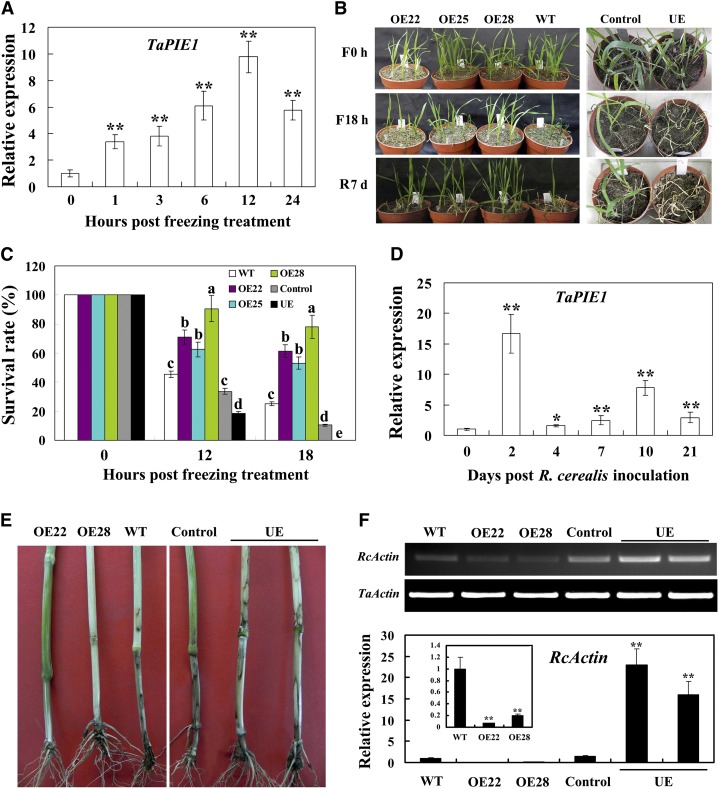
Figure 2.
TaPIE1 promotes wheat responses to freezing and R. cerealis stresses. A, qRT-PCR analysis of TaPIE1 induction by freezing stimulus. Total RNA was extracted from the leaves of cv Yangmai 12 plants after –5°C freezing treatment for the indicated times. B, Freezing-tolerant phenotypes of the wild-type (WT) cv Yangmai 12, TaPIE1-overexpressing (OE; OE22, OE25, and OE28) TaPIE1-underexpressing (UE), and control plants. F0 h and F18 h indicate growth under freezing conditions for 0 and 18 h, respectively; R7 d indicates recovery growing under normal conditions for 7 d after 18 h of freezing treatment. C, Survival rates of the OE, wild type, UE, and control cv Yangmai 12 seedlings at 12 and 18 h under freezing stresses. For A to C, seedlings at the four-leaf stage were grown at 4°C for 6 h and then kept at –9°C (for the OE and control plants) or –5°C (for the UE and control plants) for the indicated times. D, qRT-PCR analysis of TaPIE1 induction after R. cerealis inoculation. Total RNA was extracted from the leaf sheaths of cv Yangmai 12 plants for the indicated times. E, Typical infection phenotypes of the OE, UE, wild type, and control cv Yangmai 12 plants after R. cerealis inoculation for 55 d. F, qRT-PCR analysis of R. cerealis relative biomass based on the transcript level of the R. cerealis ACTIN gene (RcActin). For C to F, seedlings at the four-leaf stage were infected with R. cerealis. The amplification of the wheat ACTIN gene was used as an internal control to normalize all the data. Significant differences were analyzed based on the results of three replications (Student’s t test: *P < 0.05, **P < 0.01). Error bars indicate se. [See online article for color version of this figure.]

