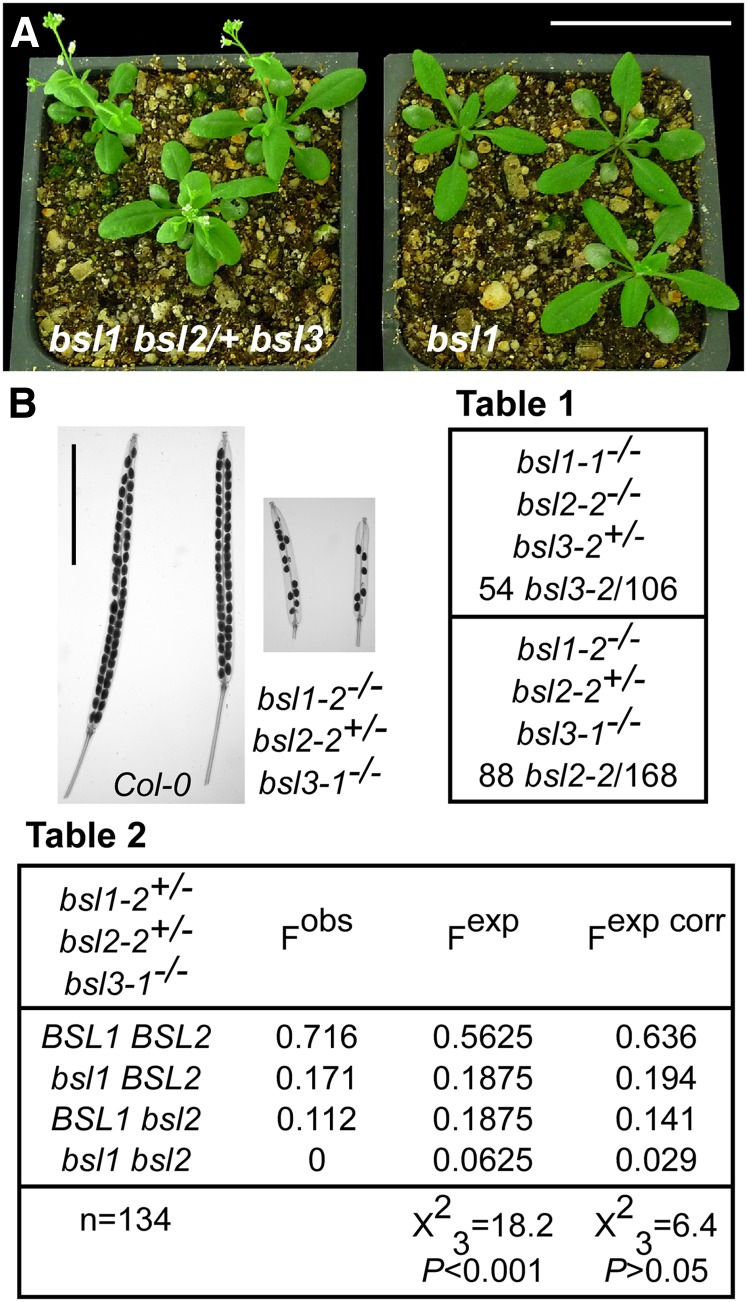
Figure 8.
Effects of the simultaneous loss of function of BSL1, BSL2, and BSL3. A, Comparison between 3-week-old bsl1-2−/− bsl2-2+/− bsl3-1−/− (left) and bsl1-2−/− (right) plants. Bar = 5 cm. B, Cleared mature siliques of the indicated genotypes. Bar = 5 mm. Table 1, The progeny of the indicated genotypes carrying the segregating mutant allele significantly departed from the expected 3:1 ratio. Observed frequencies are as follows: 51% for bsl1-1−/− bsl2-2−/− bsl3-2+/− and 52% for bsl1-2−/− bsl2-2+/− bsl3-1−/−. Table 2, The progeny of the indicated genotypes significantly departed from the expected 9:3:3:1 ratio for two unlinked loci and fully viable gametes (Fobs versus Fexp). When the proportion of female gametes is corrected as 0.33 (BSL1 BSL2):0.33 (bsl1 BSL2):0.225 (BSL1 bsl2):0.115 (bsl1 bsl2), while the proportion of male gametes is kept at 0.25 for each genotype, the frequency distributions are not significantly different (Fobs versus Fexp corr). bsl1 and bsl2 indicate the presence of the T-DNA insertions. Data were compared with a χ2 test. [See online article for color version of this figure.]

