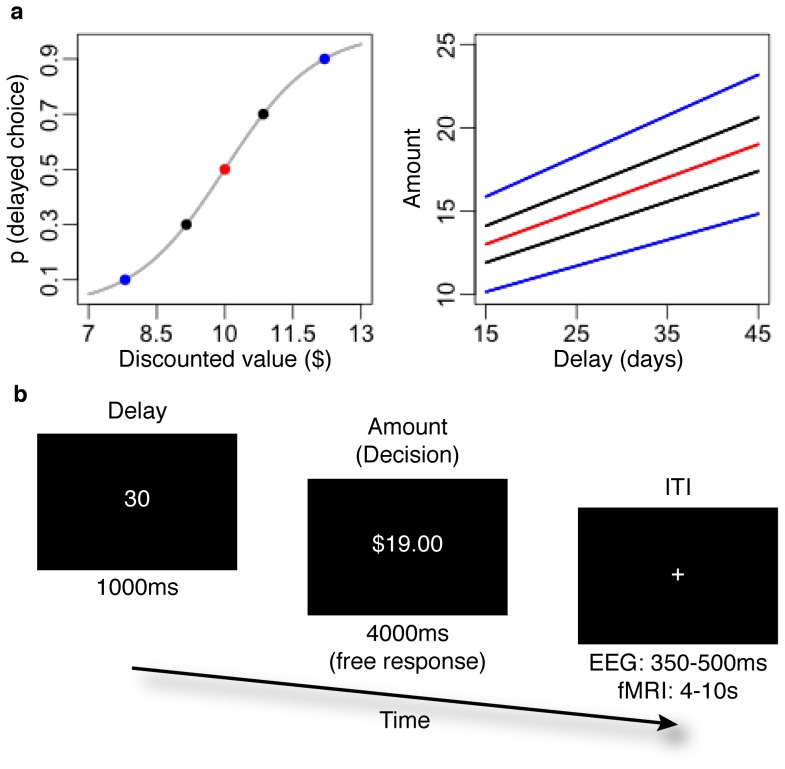
Figure 1. Experimental design.
(a) Delayed reward offers corresponded with one of five different levels of discounted value. Each level of discounted value corresponded to one of five probabilities of choosing the delayed reward: 0.1, 0.3, 0.5, 0.7 or 0.9. (b) Every delay could be combined with any of five different amounts to yield a different discounted value and probability of choosing the delayed reward. (c) Delay and amount information was presented sequentially. Delays were presented first for 1000 ms. Amounts were presented second, replacing the presentation of the delay and remaining on the screen for a maximum of 4000 ms. After every trial, a fixation cross was presented on the center of the screen for a randomly chosen inter-trial-interval in the order of hundreds of milliseconds during the EEG experiment and several seconds during the fMRI experiment.

