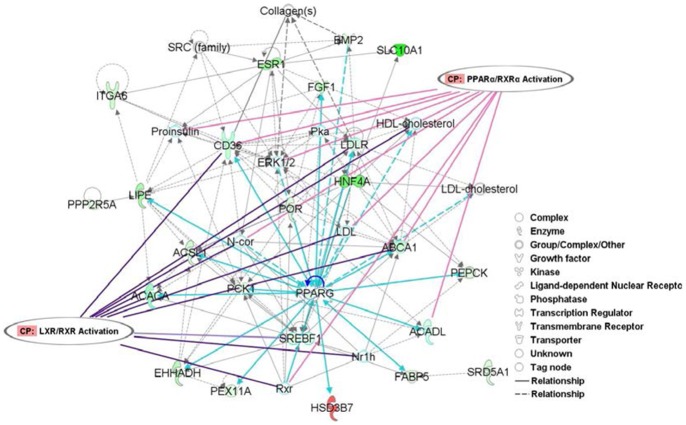
Figure 6. Functional and pathways analysis using miRNAn25&n26 target genes related to lipid and fatty acid metabolism as input date.
The node colour indicated the expression of genes: (red) up-regulated and (green) down-regulated in adult stage relative to fetal stage. The shapes of nodes indicated the functional classes of the gene products. Relevant canonical pathways that feature modulated genes were indicted as well (e.g. LXR/RXR Activation and PPARα/RXRα Activation).

