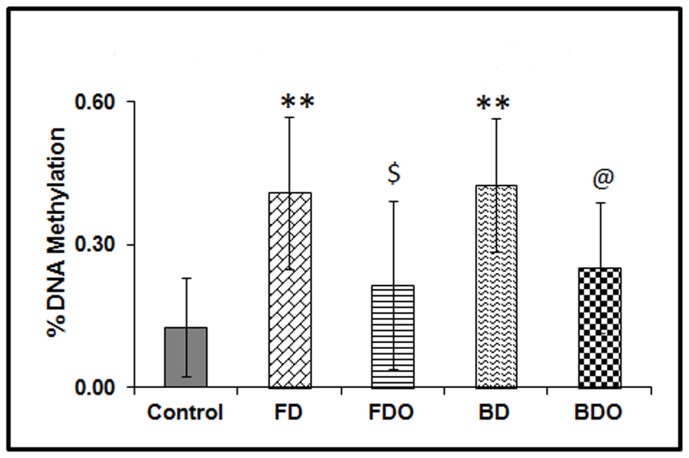
Figure 1. Pup liver global DNA methylation in different groups.
Data in each group is on 4 males and 4 females. The treatment groups were compared with the control group by One Way ANOVA and the post-hoc least significant difference test. Results are presented as mean ± SD (standard deviation). **p<0.01 as compared to control; $p<0.05 as compared to FD group; @ p<0.05 as compared to BD group. Control – Normal folic acid, normal vitamin B12; FD– folic acid deficient; BD – vitamin B12 deficient; FDO– folic acid deficient and omega-3 fatty acid supplementation; BDO– vitamin B12 deficient and omega-3 fatty acid supplementation.

