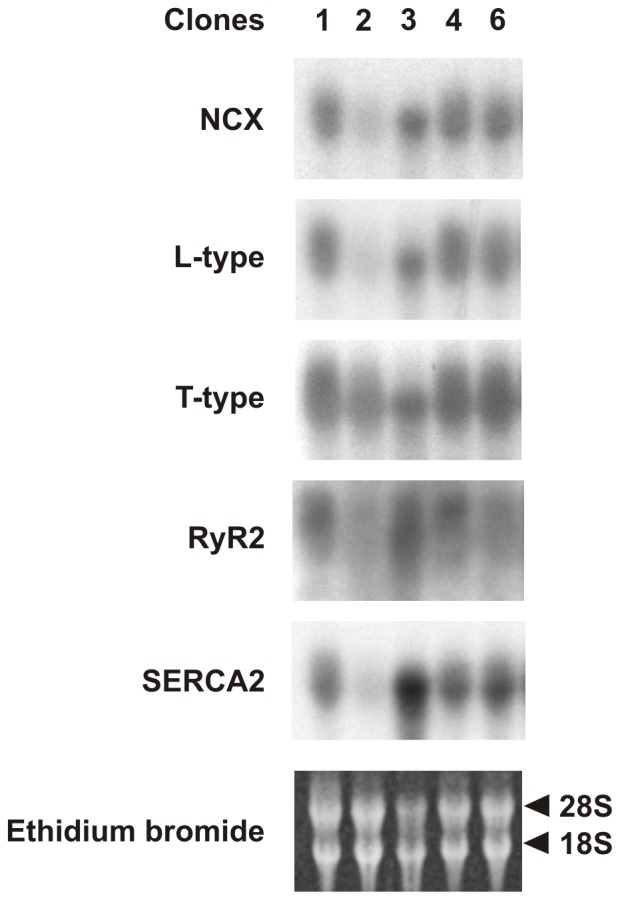
Figure 1. Northern blot analysis of total RNA extracted from the HL-1 clones (indicated on top of the picture).

Membranes were hybridised with probes for NCX, L-type Ca2+ channel, T-type Ca2+ channel, RyR2 and SERCA2 as indicated on the left of the picture. Membranes were stained with ethidium bromide to visualize the ribosomal RNA bands 18S and 28S.
