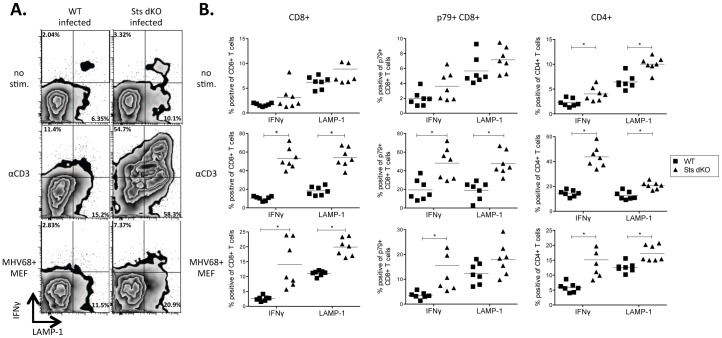
Figure 2. Sts dKO CD4+ and CD8+ T cells have increased effector responses to infected cells.
Sts dKO and C57BL/6 WT mice were infected 1000 PFU of MHV68 by the intranasal route and spleens were harvested 28 dpi. Stimulations were performed as described in Figure 1 with the addition of αLAMP1, followed by costaining for CD4, CD8, and p79 tetramers. (A) Representative flow plots of LAMP-1 and IFNγ expression on CD8+ T cells are shown for each genotype and culture condition. (B-D) Scatter plot of the percentage of the indicated T cell subsets positive for IFNγ or LAMP-1. Axes were adjusted to better illustrate differences within each experimental condition. Symbols represent data from individual mice. * = p<.05, ** = p<.01, *** = p<.001. **** = p<.0001.

