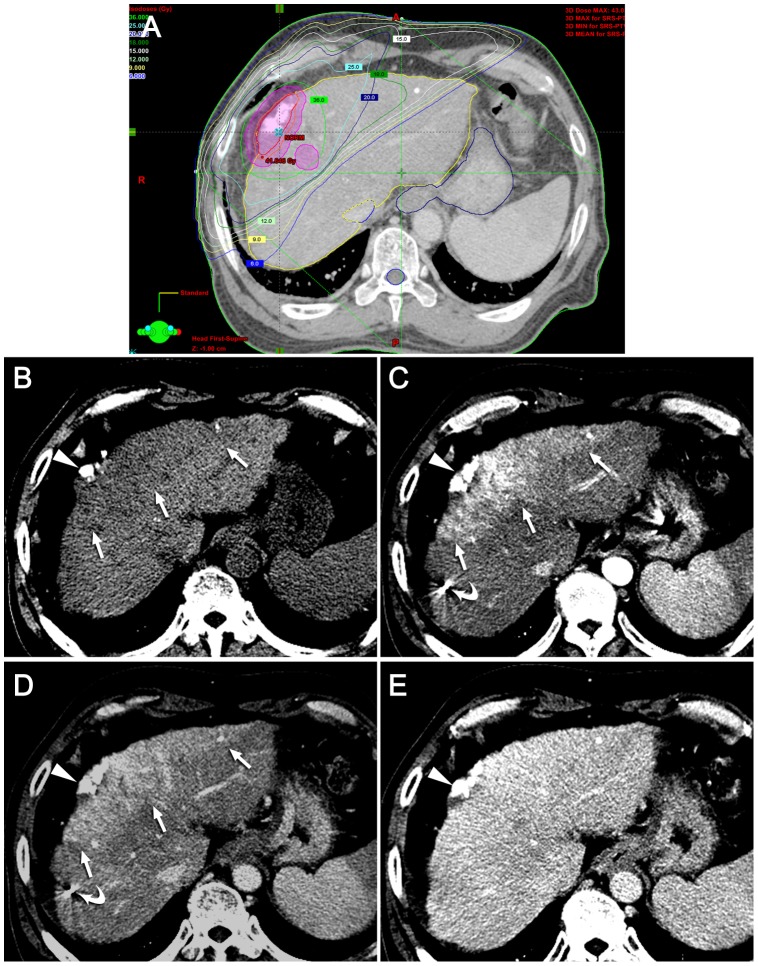
Figure 3. Typical hepatic attenuation difference seen on three months after SBRT.
(A) Dose distribution is demonstrated on the isodose curve for SBRT. The planning target volume (PTV, purple circle) as well as the gross tumor volume (red circle) in the peripheral portion of the right lobe of the liver, was treated with 36 Gy of the total radiation dose. The irradiated hepatic parenchyma is delineated corresponding to the region inside the 15-Gy isodose line but outside the PTV boundary. (B-E) Multiphase CT images obtained three months after SBRT depict low attenuation (arrows) on noncontrast CT (B), high attenuation (arrows) on the arterial (C) and portal (D) phases, and isoattenuation on the delayed (E) phase, respectively. The target tumor (arrowheads) in the peripheral portion of the right lobe of the liver was treated using transarterial chemoembolization prior to SBRT. Fiducial markers are also seen (curved arrows).

