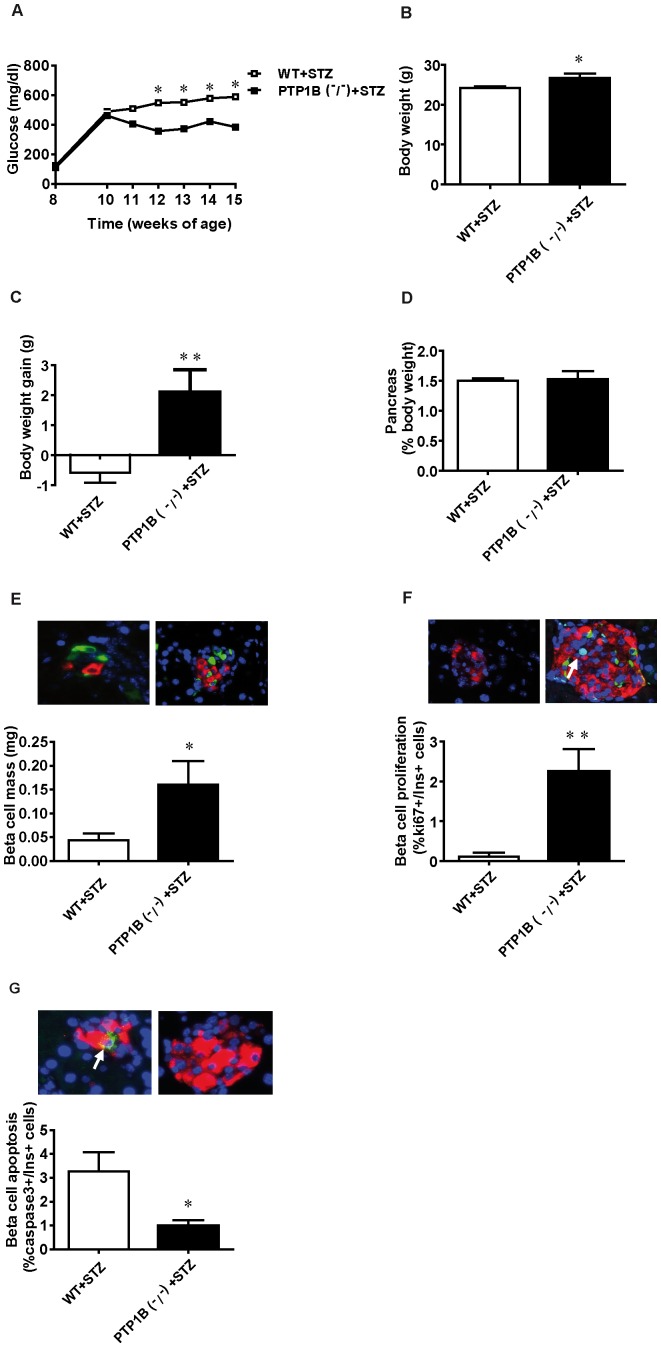
Figure 5. β-cell mass recovery after streptozotocin-induced diabetes in PTP1B −/− mice.
A) Blood glucose levels along the experimental period (7 weeks) after STZ-induced β-cell damage in PTP1B −/− and WT fed mice. B) Body weight at the end of the experimental period after STZ-induced β-cell damage in PTP1B −/− and WT fed mice. C) Body weight gain 7 weeks after STZ injection in both experimental groups. D) Pancreas weight (normalized by body weight) of STZ-treated PTP1B −/− and WT fed mice 7 weeks after STZ injection. E) β-cell mass is quantified blindly as β-cell volume density, multiplied by pancreas weight (n = 6 animals per group). Representative images showing immunostaining for insulin (red), glucagon (green), and Dapi for nuclei (blue) on pancreatic sections from STZ-treated PTP1B −/− and WT mice. F) Levels of proliferating β-cells (ki67+/insulin+) in STZ-treated PTP1B −/− and WT mice (n = 6 animals per group). Representative images showing immunostaining for insulin (red), ki67 (green), and Dapi for nuclei (blue) on pancreatic sections from STZ-treated PTP1B −/− and WT mice. G) Levels of apoptotic β-cells (caspase3+/insulin+) in STZ-treated PTP1B −/− and WT mice. (n = 6 animals per group). Representative images showing immunostaining for insulin (red), Caspase3 (green), and Dapi for nuclei (blue) on pancreatic sections from STZ-treated PTP1B −/− and WT mice. All results represent mean±SEM; * p<0.05, ** p<0.005 PTP1B −/− + STZ vs WT + STZ.

