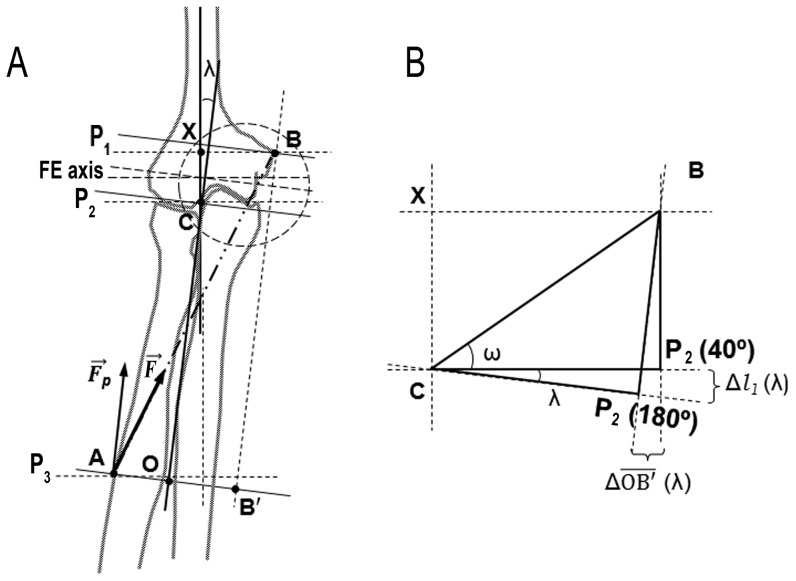
Figure 1. Representation of the influence of carrying angle (λ) on several parameters used to calculate rotational efficiency.
A: Anterior view of right distal arm and forearm bones in supination position. Humeral and forearm axes, the flexion-extension axis (FE axis), as well as the force exerted by pronator teres muscle ( , from point A to point B), are represented.
  is the vertical component of pronator teres force. Point A indicates pronator teres distal enthesis just at the apex of radial curvature. Point B indicates its proximal attachment site, just at the apex of the medial epicondyle, and point B′ is the projection of point B on plane P3. Planes P1, P2 and P3 are parallel to each other and perpendicular to the forearm axis. P1 passes through point B, P2 passes through the most proximal point of the radial head and P3 passes through point A. Point X is the intersection between humeral axis and a plane perpendicular to the humeral axis that passes through point B. Point C is the most distal humeral point of the humeral axis. Point O is the intersection between plane P3 and the forearm axis. The dashed circle indicates the zoomed-in area of the right image. B: Detail of the left image. Plane P2 is represented for a position of full elbow extension (P2 (180°)) and for a position of full elbow flexion (P2 (40°)). The variation of this plane is caused by the variation of the carrying angle (λ). This causes a variation in l1 and in
  (Δl1 (λ) and Δ
 (λ)), which depends on the elbow angle. Angle ω is the angle between plane P2 (40°) and
  segment.

