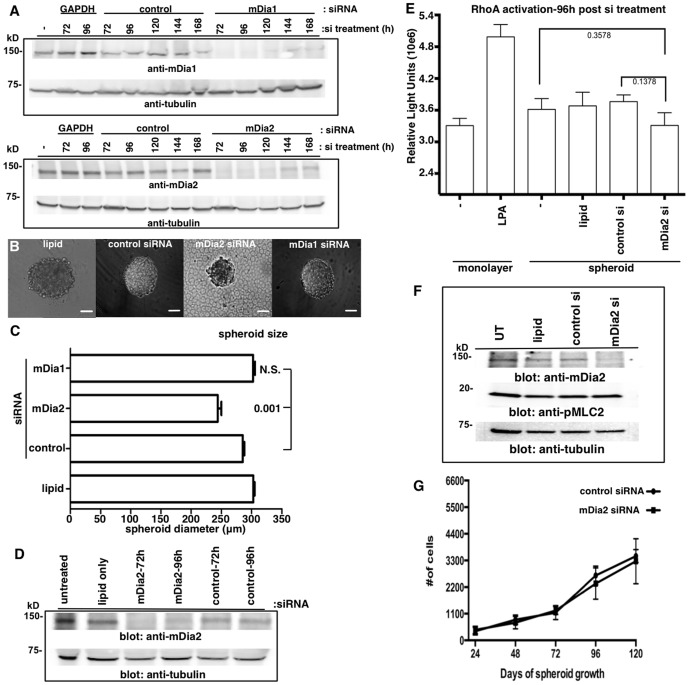
Figure 4. mDia2 depletion induces formation of small, disorganized spheroids.
A. siRNA-mediated mDia1 (upper) or mDia2 (lower) knockdowns were performed upon ES-2 monolayers (Note: out of focus plate-coating imaging artifact/condensation within irregular plastic plates seen here is common to BF imaging). B–C. After 72 h post-siRNA or control treatment, spheroids were formed and diameters measured under brightfield microscopy 48 h later (120 h post-siRNA treatment). Bar = 100 µm. At least 30 spheroids were measured for each condition. p values are listed above bars and are relative to control siRNA spheroids. D–E. ES-2 monolayers were untreated or treated with the designated siRNAs for 48 h, spheroids formed for an additional 48 h, and Western blots or RhoA G-LISAs performed upon lysates. LPA is a positive control for RhoA activation. The G-LISA experiment was performed twice, in quadruplicate, and combined data is shown with p values listed to the side of bars. P values are relative to either untreated or control siRNA-treated spheroids, as noted. F. Untreated (UT), lipid only or siRNA-mediated control and mDia2 knockdowns were performed upon ES-2 monolayers for 72 h and pMLC2 levels assessed by Western blotting. G. Control and mDia2 knockdowns were performed for 72 h, and spheroids formed. Spheroids were disaggregated at the indicated times after formation and cells counted. The experiment was repeated 5 times. A representative experiment is shown. Error bars correspond to SDs from a representative experiment.

