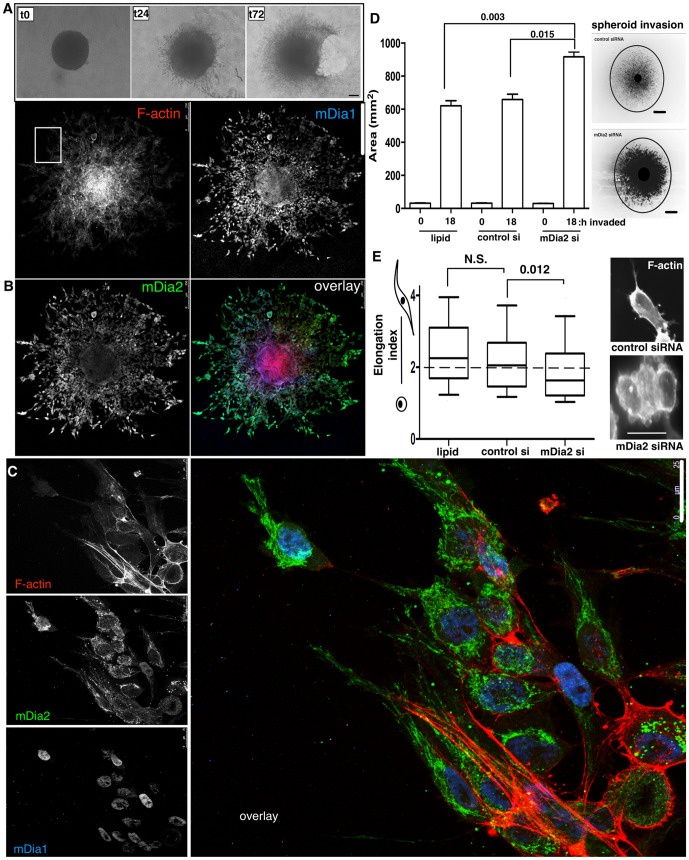
Figure 5. mDia2 depletion drives ES-2 spheroid invasion via amoeboid transitions.
A. Spheroids were formed first for 48-I gels, and imaged by brightfield microscopy after the designated times. Bar = 150 µm. B. Spheroids were formed for 72 h, embedded in collagen I gels and allowed to invade for 24 h. Spheroids were fixed and IF performed for mDia1, mDia2 and F-actin. Bar = 100 µm. C. Higher magnification image (63×) of invading cells from the designated ROI in B. mDia1, mDia2, and F-actin were visualized by confocal microscopy. Bar = 25 µm. D. After 56 h post-siRNA treatment, spheroids were formed and embedded in collagen at 104 h post-siRNA treatment. The area for ROI drawn corresponding to 95% of invasive cells was calculated for 0 and 18 h post invasion (122 h post-siRNA treatment). Representative spheroids at 4X are shown stained for phalloidin and images contrast enhanced. Bar = 100 µm. At least 30 spheroids were measured for each condition. p values are shown above the histogram and are relative to invasion at 18 h for either lipid or control treated spheroids. E. Elongation indices were calculated for invasive cells from D. At least 30 invasive cells were measured per condition. Representative phalloidin staining is shown. Bar = 25 µm. EI> 2 (dashed line) is considered mesenchymal cell type. p values are shown above the plot and are relative to invasion at 18 h for either lipid or control treated spheroids. All error bars correspond to SDs from a representative experiment.

