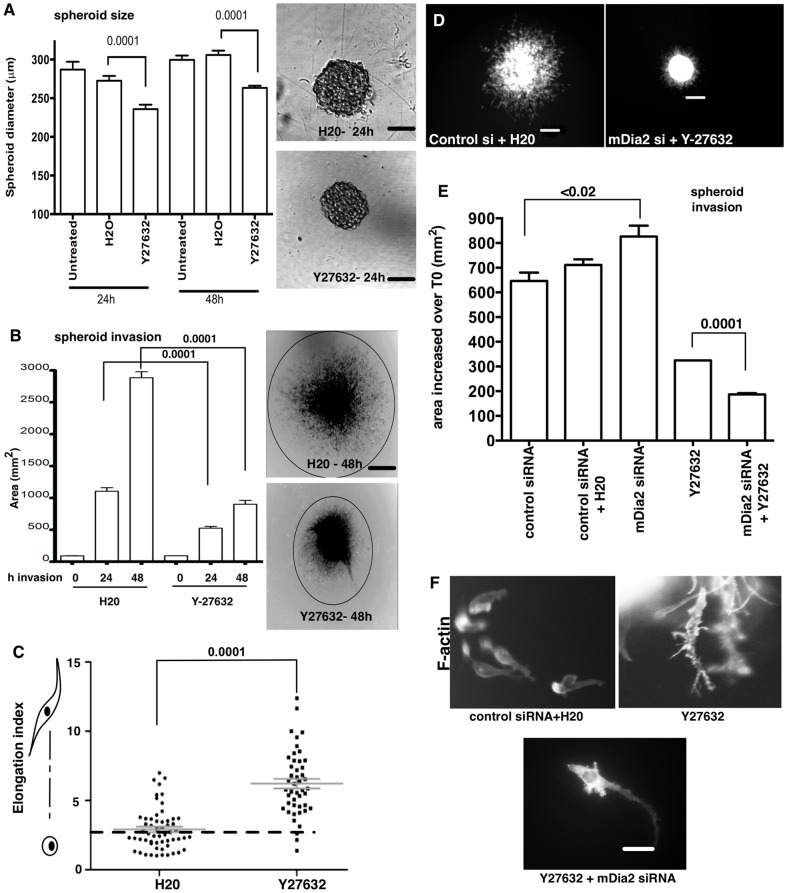
Figure 6. ROCK signaling drives ES-2 spheroid invasion.
A. Spheroids were formed in the presence of vehicle or 90 µM Y27632 for the indicated times. Spheroid diameters were then measured for at least 30 spheroids at 10×. Bar = 100 µm. p values are shown above the plot and are control H20-treated spheroids. B. Spheroids were formed for 48 h in the presence of Y27632, and then embedded in collagen-I for 0–48 h in the presence of vehicle or Y27632. Invasive fronts were measured at each time point for at least 30 spheroids per condition. Bar = 400 µm. Representative spheroids at 4× are shown stained for phalloidin and images contrast enhanced. P values are listed above the graph and are relative to control H20-treated spheroids. C. Elongation indices were calculated for invasive cells in the collagen gels shown in B. EI> 2 (dashed line) were considered mesenchymal cell type. At least 30 cells were measured per condition. p values are listed above the chart and are relative to control H20-treated spheroids. D–E. Spheroids were formed in the presence of Y27632; siRNA-treated spheroids were formed at 48 h post-siRNA treatment in the presence of 90 µM Y27632. Spheroids were then embedded in collagen for 24 h Y27632 was maintained in both the gel and media with spheroids through 104 h post-siRNA treatment, and upon embedding for an additional 24 h. Spheroids were fixed and stained for F-actin. Images shown in D are 4× and scale bar = 200 µm. At least 20 spheroids were measured for each condition for E. p values are listed above (E) and are relative to control siRNA-treated spheroids, or Y27632-treated spheroids, as noted. F. Representative 40× phalloidin staining of invasive cells. Bar = 40 µm. All error bars correspond to SDs from a representative experiment.

