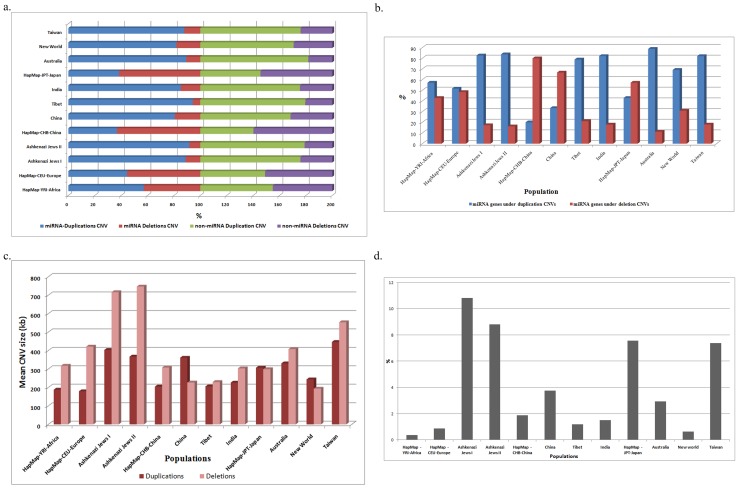
Figure 2. Distribution of miRNA CNVs and genes across 12 populations.
a) Represents distribution of miRNA and non-miRNA CNV types b) represents burden of miRNA genes under duplication and deletion CNVs; c) represents mean duplication and deletion CNV size; d) represents the percent distribution of singleton miRNA gene.

