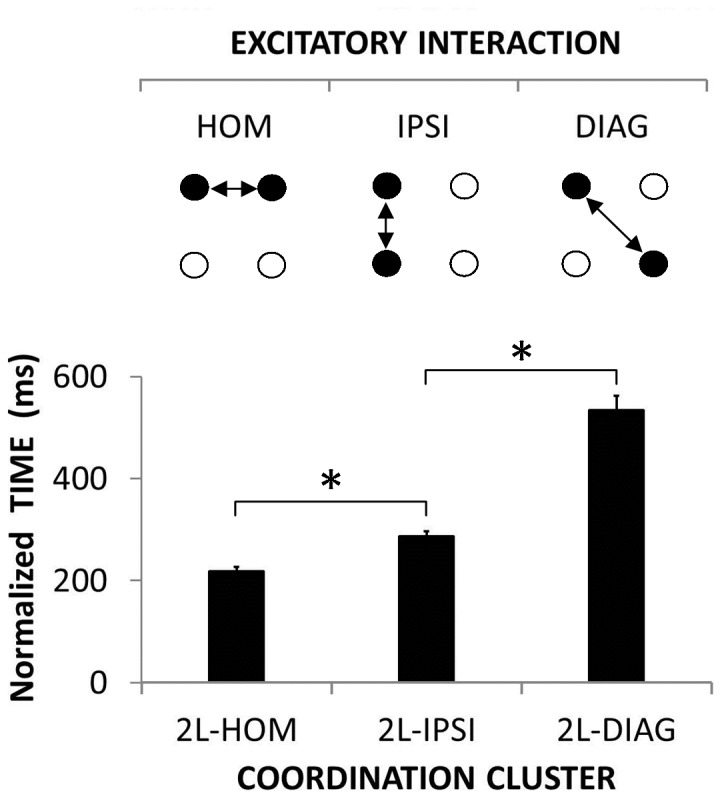
Figure 5. Coupling of effector-specific networks.

Normalized time as a function of the three 2-limb coordination clusters. Normalized time reflects excitatory interaction, i.e., the shorter the RT the stronger the interaction. Each circle stands for one effector-specific brain network. Black-filled circles illustrate networks associated with moving effectors and white-filled circles represent non-moving effectors. Arrows depict excitatory interaction between moving effectors. (Mean ± SEM; L = limb; DIAG = diagonal; IPSI = ipsilateral; HOM = homologous; * = significant difference).
