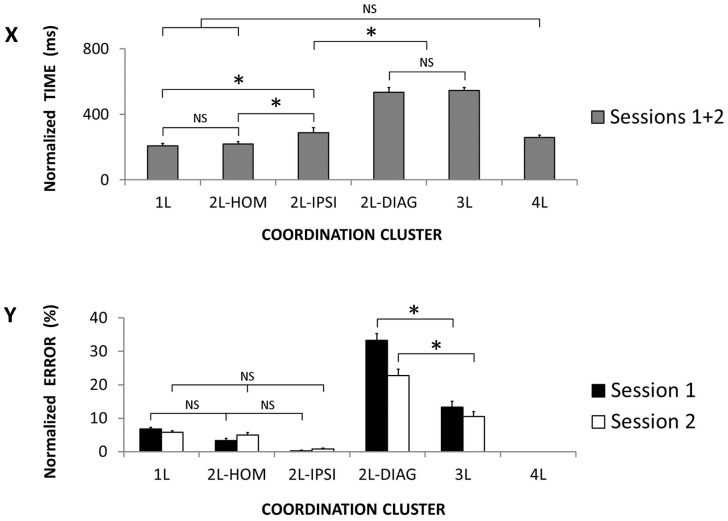
Figure 9. Selection complexity of coordination clusters.
X. Normalized time performance (gray columns) as a function of the six coordinations clusters. Y. Normalized error rate as a function of the six coordination clusters in Session 1 (black columns) and 2 (white columns). (Mean ± SEM; L = limb; DIAG = diagonal; IPSI = ipsilateral; HOM = homologous; NS = non-significant difference; * = significant difference).

