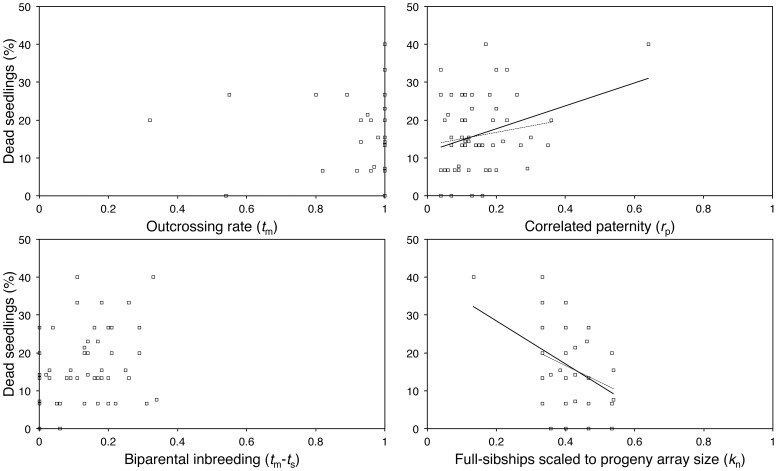
Figure 2. Scatterplots showing relationships between Eucalyptus gracilis family-level establishment rates and mating system parameters.
Establishment rate percentages per progeny array are shown on the y-axis and mating system parameter values shown on the x-axis. Linear trend lines between genetic parameters and growth shown for relationships where ΔAICc <4 (ΔAICc values presented in Table 3). Trend lines are for all data are solid and trend lines are for data without the outlier are dashed.

