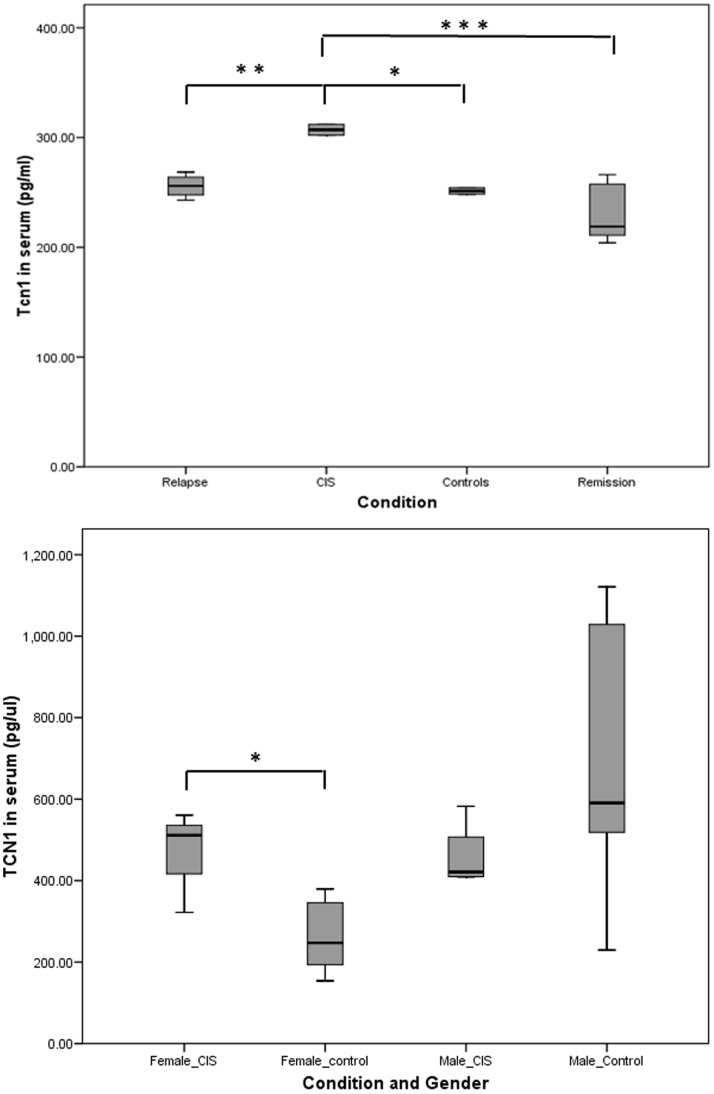
Figure 6. Serum concentration of Tcn1 of patients in remission, relapse and CIS and healthy controls.
A: box-plot of the protein concentration values in the four groups of the first sample set (49 samples). B: box-plot of the protein concentration values of the samples of the second set (19 samples). *p<0.05; **p<0.01; ***p<0.001.

