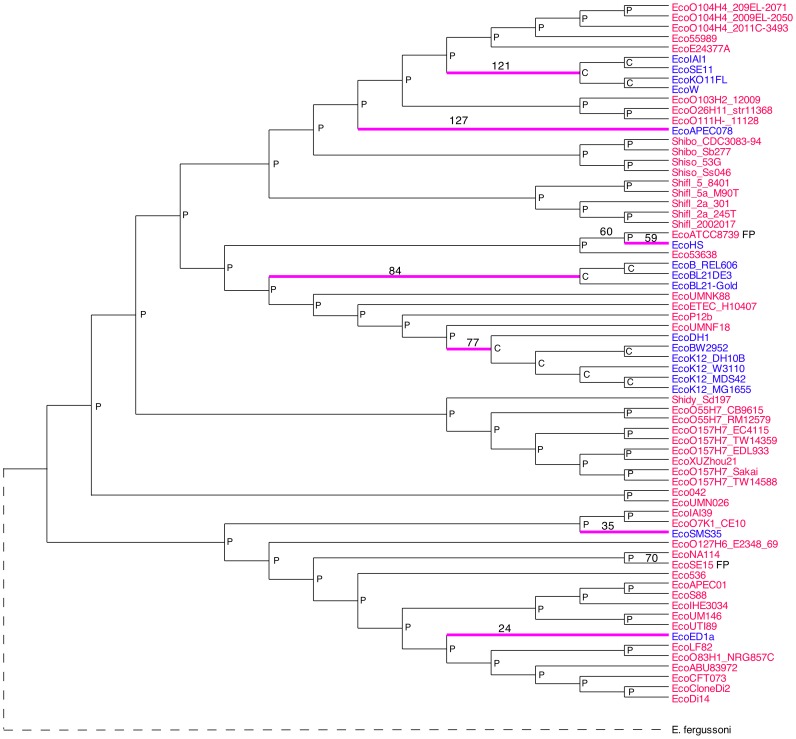
Figure 1. ML tree estimated by MEGA 5.
The predicted phenotypes are indicated by the text color of the taxa: Red = pathogenic, Blue = commensal. The ancestral phenotypes are indicated by P (pathogenic) or C (commensal) at the internal nodes. Branches along which the phenotype changed are indicated in magenta. Numbers above some branches indicate the branch number given in Table S7. The dashed line indicates the virtual rooting with Escherichia fergusonii.

