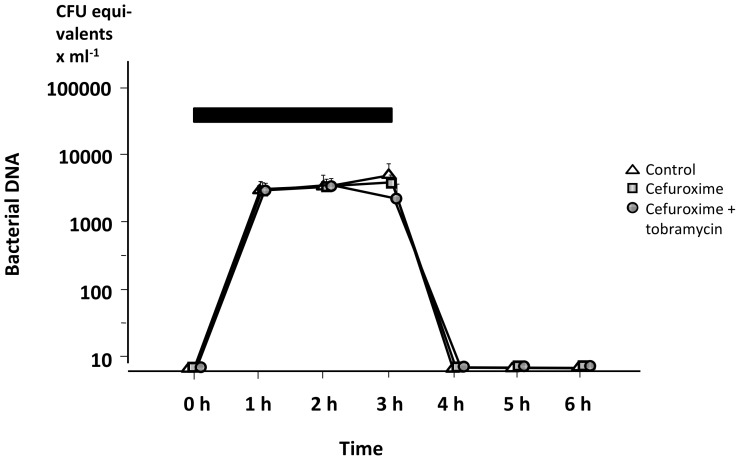
Figure 5. In vivo bacterial DNA in the blood of treated animals.
The treatment was either cefuroxime alone, a combination of cefuroxime+tobramycin, or saline (control), during the 6 h experiment. Black bar denotes the infusion of live E. coli. The quantity of bacterial DNA is expressed as CFU equivalents. Values are mean±SE (n = 3 in each group).

