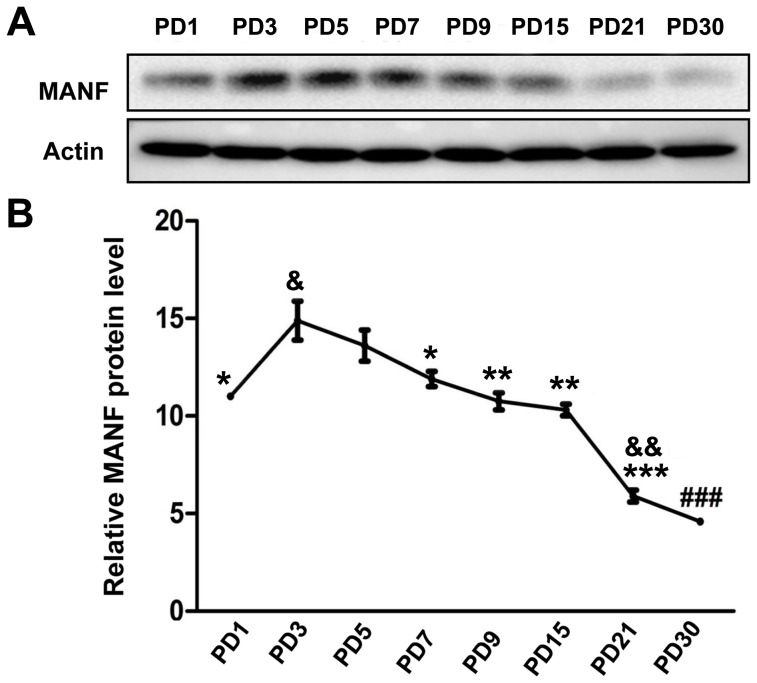
Figure 2. Study of developmental expression of MANF in the cerebral cortex by immunoblotting analysis.
A: Rat pups were sacrificed at the indicated postnatal days (PD1-30). The cerebral cortex was dissected and homogenized. Equal amount of sample was pooled (3–5 pups per group) and subjected to immunoblotting analysis using an anti-MANF antibody described in Fig. 1. B: The relative expression of MANF was quantified by densitometric analysis. & p<0.05, && P<0.01 compared with PD1; *p<0.05, **P<0.01, ***P<0.001 compared with PD3, and ### P<0.001, compared with other groups.

