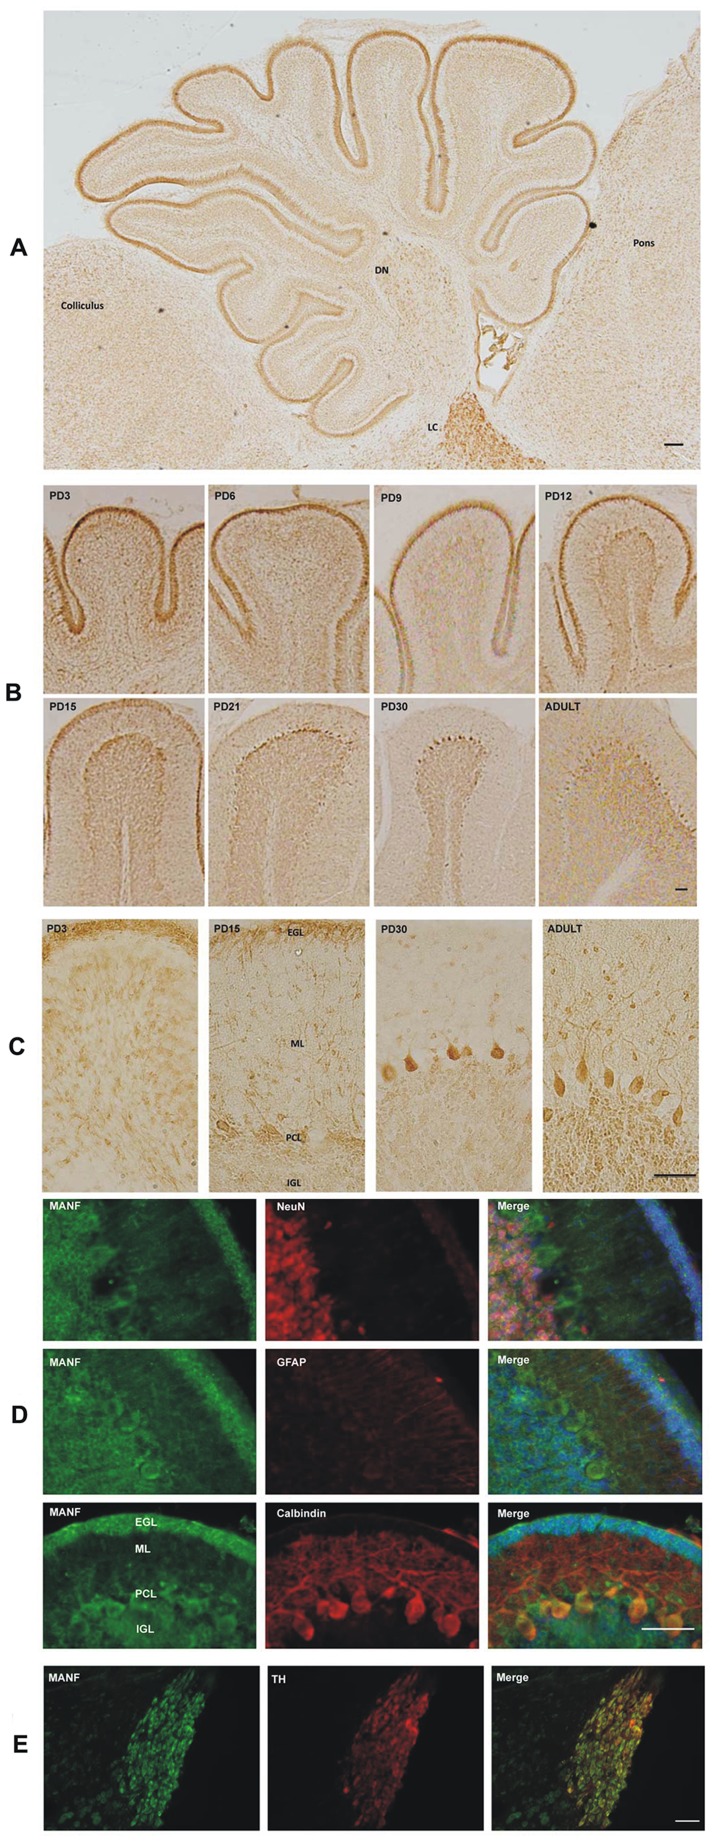
Figure 8. MANF expression in the cerebellum.
A: MANF expression in the cerebellum of PD6 pups was determined by IHC. DN, deep cerebellar nuclei; LC, locus coeruleus. Scale bar = 100 µm. B: Rat pups were sacrificed at the indicated postnatal days. MANF expression in the cerebellum was determined by IHC. Scale bar = 100 µm. C: Images of higher magnification showing MANF expression in the external germinal layer (EGL), molecular layer (ML), Purkinje cells (PCs) and internal granule layer (IGL). Scale bar = 100 µm. D: Double-labeling immunofluorescent staining was performed to determine the identity of cells expressing MANF. The images showed the expression of MANF (green), NeuN (red), GFAP (red), Calbindin (red) and DAPI (blue) in the cerebellum of PD15 rat pups. Scale bar = 25 µm E: Co-localization of MANF (green) with tyrosine hydroxylase (TH) (red) in the LC of PD15 rat pups. Scale bar = 100 µm.

