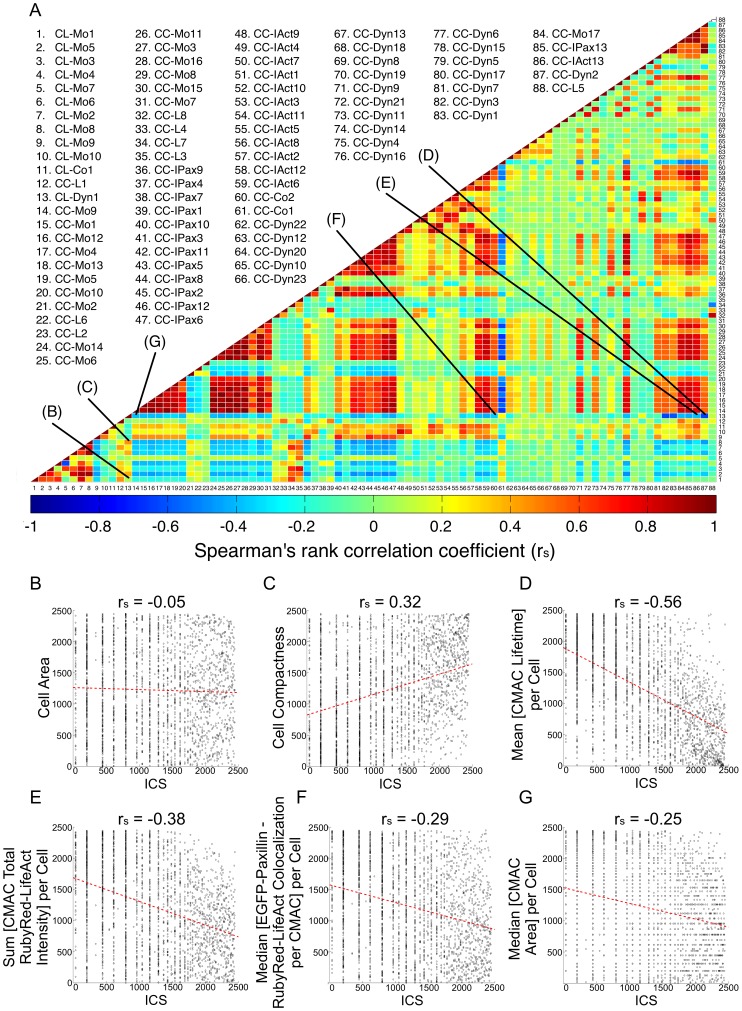
Figure 4. Exploration of individual feature correlations.
(A) A heat map of Spearman’s rank correlation coefficients (rs) summarizes the pairwise correlative relationships between all 88 recorded variables (organizational and behavioral, compact feature names defined in Supporting Table S1) based on ranked observation values (blue = negative rs; red = positive rs; green = rs ∼ 0). (B–G) Selected correlations to ICS (indicated in heat map by lines (B)–(G), corresponding to panels B–G) plotted as ranked values of ICS (X-axes) vs ranked values of organizational features (Y-axes): Cell Area (B); Cell Compactness (C); Mean [CMAC Lifetime] per Cell (D); Sum [CMAC Total RubyRed-LifeAct Intensity] per Cell (E); Median [EGFP-Paxillin – RubyRed-LifeAct Colocalization per CMAC] per Cell (F); Median [CMAC Area] per Cell (G). Red dotted trend lines represent linear best fits.

