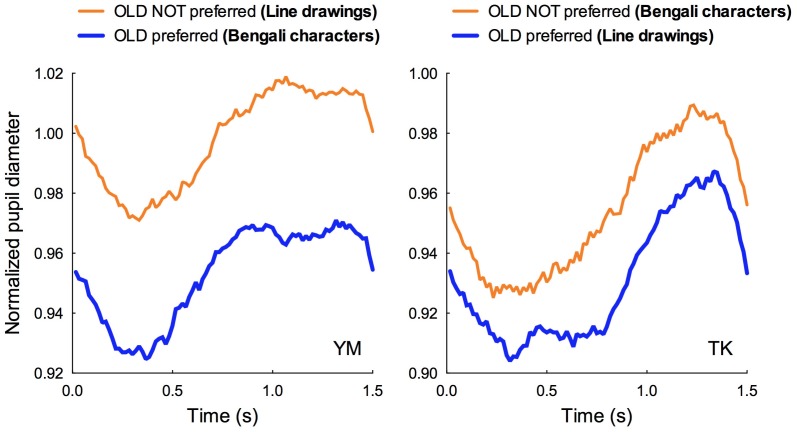
Figure 8. Normalized pupil diameter during a single exposure session as a function of time.
Pupil diameter was averaged over 80 exposures (20 exposures×4, as shown in Figure 2). The fixation mark was presented from 0.0 to 1.0 s on the horizontal axis. The visual pattern and the mask pattern were presented following the 0.5-s period. The blue function denotes the pupil diameter obtained from the “OLD preferred” group while the orange function denotes the pupil diameter obtained from the “OLD NOT preferred” group. Left graph: data from participant YM. YM exhibited preferences for OLD stimuli among Bengali characters but not for the line drawings. Right graph: data from participant TK. TK exhibited preferences for OLD stimuli among the line drawings but not for the Bengali characters.

