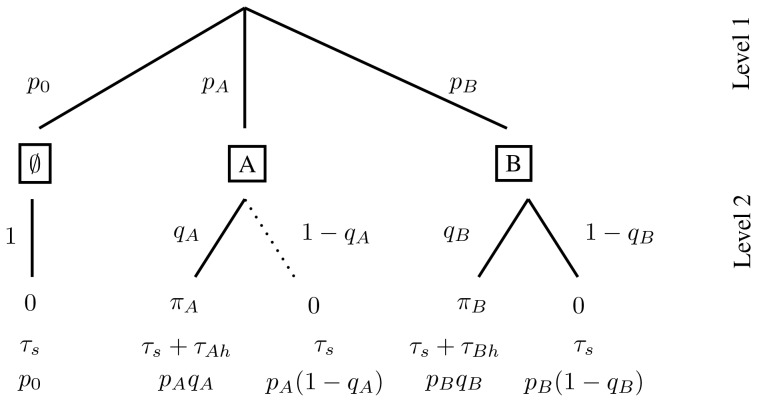
Figure 1. The decision tree for two prey types.
The first level gives the prey encounter distribution. The second level gives the predator activity distribution. The final row of the diagram gives the probability of each predator activity event and so sum to  . Since each entry here is simply the product of the probabilities along the path leading to this endpoint, we do not provide them in the decision trees from now on. With random prey distribution and
  large,
  and
and  . If prey
  is the more profitable type, the edge in the decision tree corresponding to not attacking this type of prey is never followed at optimal foraging (indicated by the dotted edge in the tree). The reduced tree is then the resulting diagram with this edge removed.

