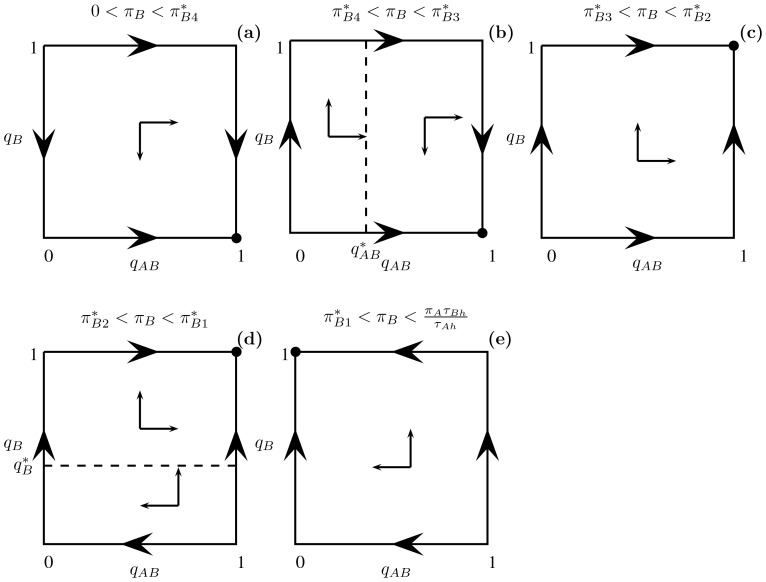
Figure 4. All qualitative outcomes of the optimal foraging strategy (8) and (10) with parameters  .
.
In these plots, the energetic value  of resource B varies in the interval from
  to
to  (i.e.
(i.e.  ). The critical values of
  are
are  ;
;  ;
;  ;
;  . The arrows in each panel indicate the direction of increasing energy intake per unit time at points in the unit square. In each case shown, these arrows lead to a single vertex indicated by the filled in circle which corresponds to the optimal foraging behavior (and unique NE). (a) For
  ,
,  and
and  . Thus
  and
and  . (b) For
  ,
,  and
and  . Thus
  and
and  . The dashed line denotes
  As
As  increases,
  moves to the right until it coincides with the vertical line
  when
when  . At this critical value of
  (not shown), all points
  on this vertical line are optimal foraging strategies (and NE). (c) For
  ,
,  and
and  . Thus
  and
and  . (d) For
  ,
,  and
and  Thus
Thus  and
and  . The dashed line denotes
  (e) For
  ,
,  and
and  . Thus
  and
and  .
.

