Figure 2.

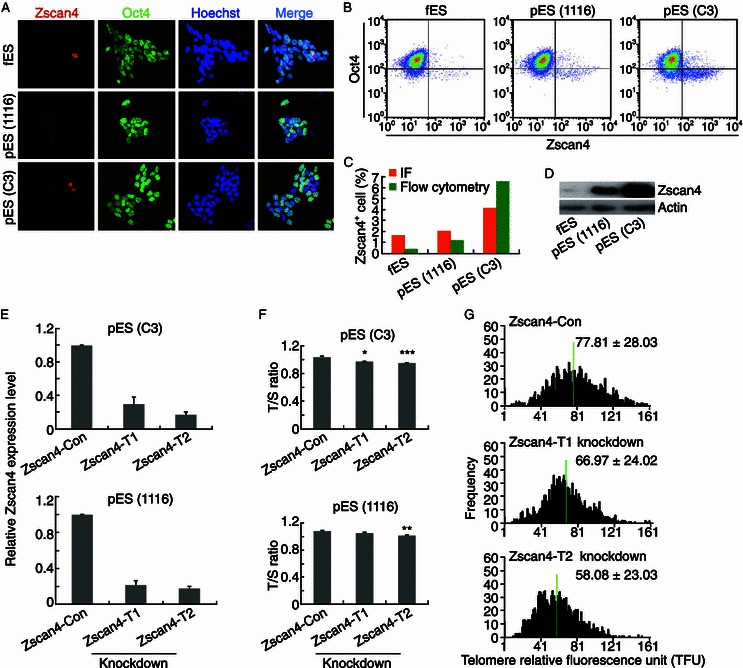
Involvement of Zscan4 in telomere elongation of pES cells. (A) Immunofluorescence images of Zscan4 (red) and Oct4 (green) in pES (1116 and C3) versus fES cells (BF10) at passage 15–16. Nuclei stained with Hoechst 33342 (blue). (B) Analysis of Zscan4+ cells in pES or fES cell cultures at passage 15–16 by flow cytometry. Two repeats. (C) Proportion of Zscan4+ cells in pES cell cultures (1116 and C3) compared with fES cell cultures (BF10) by flow cytometry and immunofluorescence microscopy. (D) Protein levels of Zscan4 in fES cells (BF10) and pES cells (1116 and C3) at passage 15–16 by Western blot. β-Actin served as loading control. (E) Zscan4 expression levels by qPCR are notably lower in Zscan4 stable knockdown (KD) pES cells (C3 or 1116) by two shRNAs (T1, T2), compared with knockdown controls. (F) Telomeres of Zscan4 knockdown (Zscan4-T1 and Zscan4-T2) pES cells (C3 or 1116) are shorter than those of control knockdown pES cells (Zscan4-Con) at passage 20 analyzed by qPCR. Error bars indicate mean ± SD. *, P < 0.05; **, P < 0.01; ***, P < 0.001, compared with control knockdown. (G) Distribution histogram showing relative telomere length as TFU in Zscan4 knockdown (Zscan4-T1 and Zscan4-T2) pES cells (C3) and in control knockdown cells (Zscan4-Con) at passage 20, analyzed by telomere Q-FISH and the TFL-TELO software. Medium telomere lengths are indicated by green bar
