Figure 2.

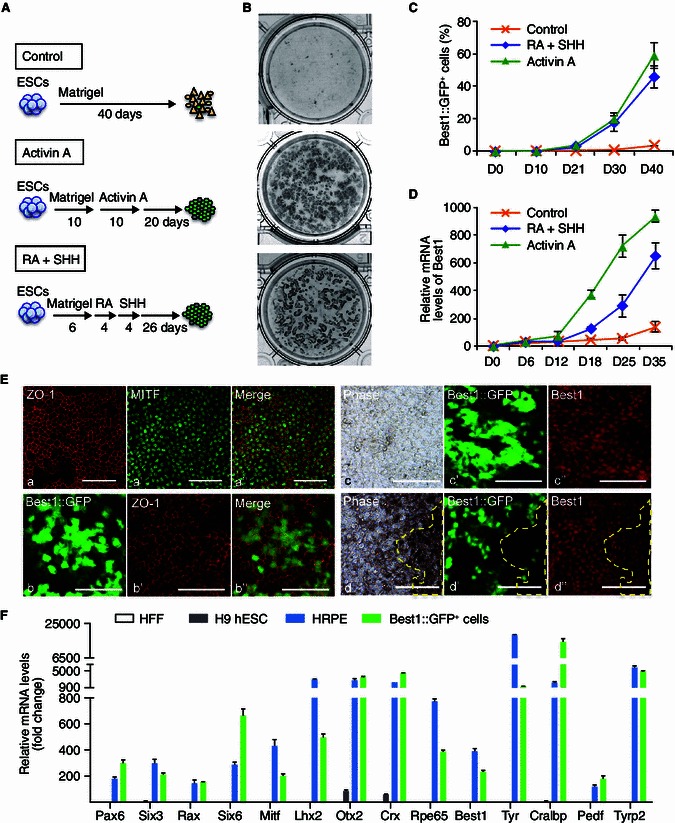
Characterization of Best1::GFP positive cells during hESC differentiation towards RPE. (A) Schematic illustration outlining differentiation of H9 hESCs with Best1::GFP reporter into RPE under different conditions. (B) Pigmentation of RPE cells differentiated from H9 hESCs using three conditions at day 40. (C) Percentages of Best1::GFP+ cells calculated by FACS analysis in indicated days of H9 hESC RPE differentiation, with different treatments as indicated in Fig. 2A. Data are presented as mean ± s.d. of three biological replicates. (D) Q-PCR analysis of Best1 mRNA expression levels in indicated days of RPE differentiation. Expression was normalized to levels in undifferentiated H9 hESC. (E) Immunofluorescence staining and phase contrast microscopy of RPE differentiation from H9 hESCs. a–a’’, Immunofluorescence analysis of ZO-1 and MITF expression at day 45. b–b’’, Best1::GFP and ZO-1 expression at day 45. c–c’’, Best1::GFP expression and immunostaining of Best1 protein. Best1::GFP is highly expressed in non-pigmented or slightly pigmented cells at day 30. d–d’’, Best1::GFP expression and immunostaining of Best1 protein at day 45. Yellow dash line highlighted area indicates diminished Best1::GFP expression in heavily pigmented cells. All scale bars: 100 μm. (F) Relative fold changes of RPE specific genes in HFF, H9 hESCs, HRPE cells and Best1::GFP+ cells which were sorted by FACS at day 40 of hESC RPE differentiation. Relative expressions were normalized to levels in HFF
