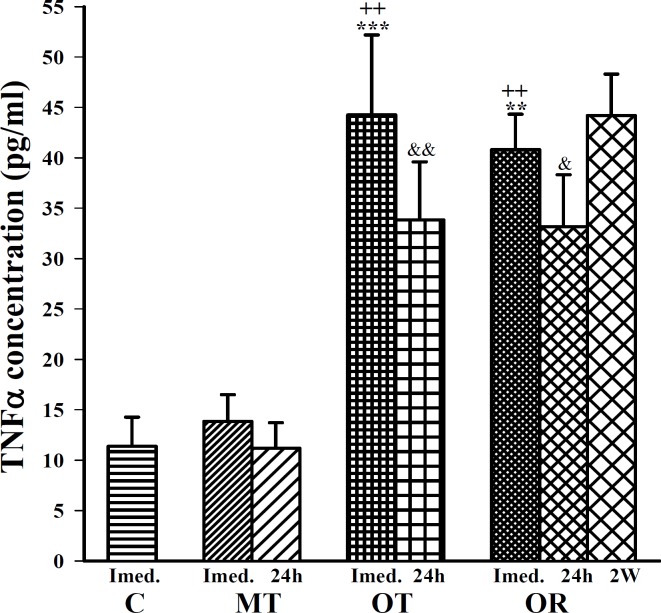
Figure 2.
The levels of serum TNF in control sedentary rats (C), moderate trained (MT), overtrained (OT), recovered overtrained (OR), (for each group, n=6).
Statistical differences between control and other groups (immediately after last bout of exercise): **; P <0.01, ***; P <0.001.
Statistical differences between MT vs OT and OR groups (immediately after last bout of exercise): ++; P <0.01, +++; P <0.001.
Statistical differences between MT vs OR group (24 hr after last bout of exercise): &; P <0.05; &&; P <0.01.
There were not statistical differences between different times in MT, OT and OR groups

