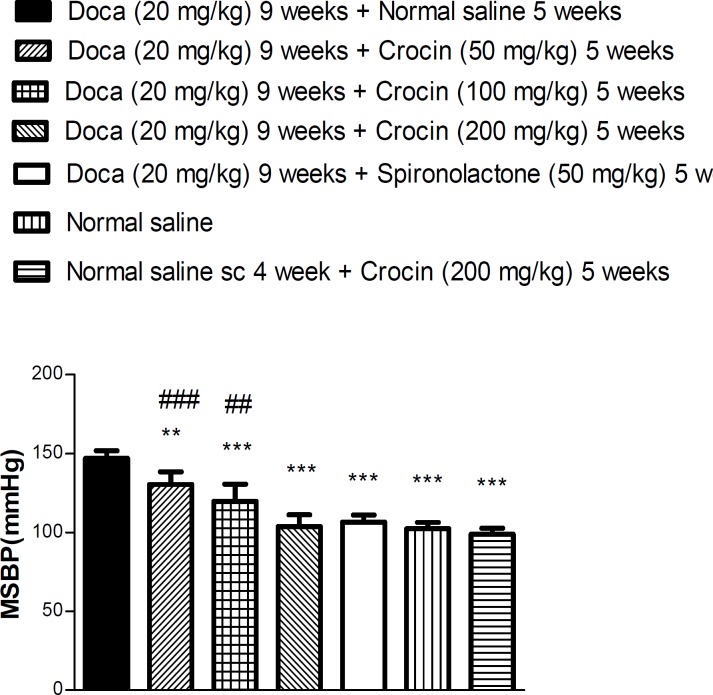
Figure 2.
Mean systolic blood pressure (MSBP) in response to various doses of crocin in normotensive and hypertensive rats at the end of nine weeks. Each value is the mean ± SEM of six experiments. One-way ANOVA, Tukey Krumer,**P<0.01 and ***P<0.001vs DOCA plus normal saline treated rats, ##P<0.01 and ###P<0.001 vs DOCA plus spironolactone

