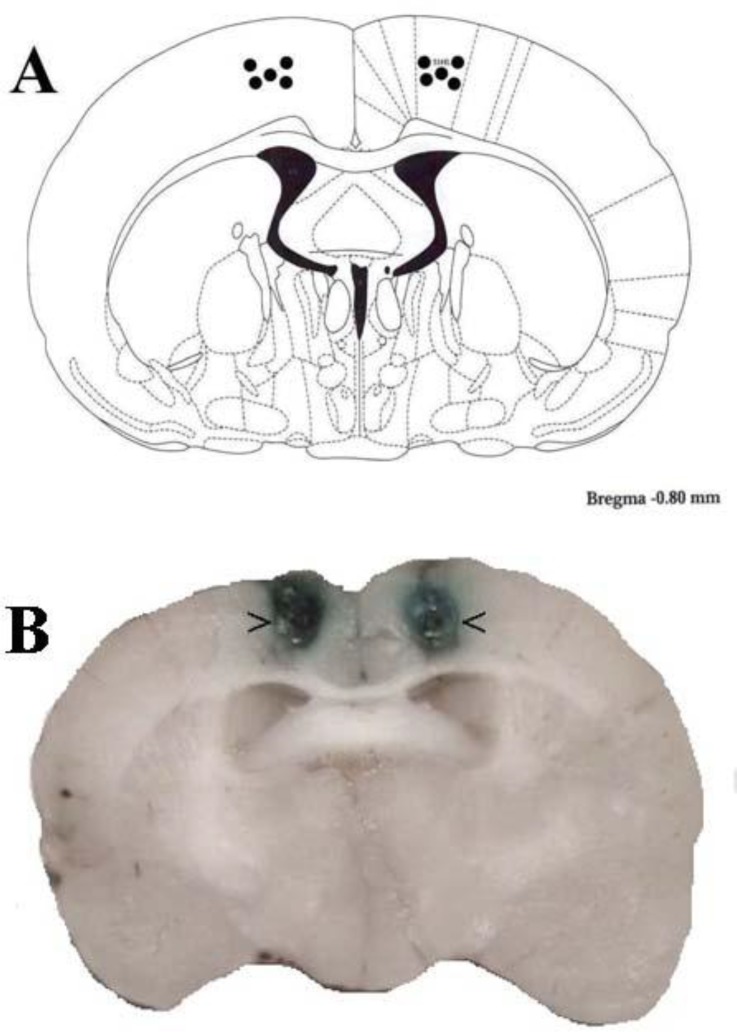
Figure 1.
Schematic illustration of coronal section of the rat brain showing the approximate location of the PSC microinjection sites (black circles) in the experiments (A). Locations of the injection cannula tips in the PSC of all rats included in the data analysis (B). Atlas plate adapted from Paxinos and Watson (16)

