Fig. 3.

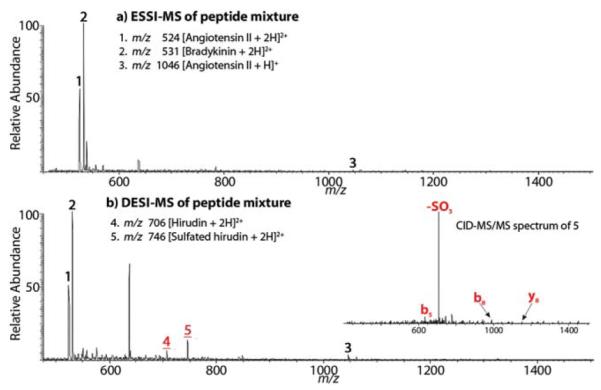
(a) ESSI-MS spectrum of a peptide mixture of bradykinin, angiotensin II and sulfated hirudin (1 : 10 : 10 by moles) at pH 3.2; and (b) DESI-MS spectrum of the peptide mixture at pH 2.0. The inset in (b) shows the CID spectrum of m/z 746.

(a) ESSI-MS spectrum of a peptide mixture of bradykinin, angiotensin II and sulfated hirudin (1 : 10 : 10 by moles) at pH 3.2; and (b) DESI-MS spectrum of the peptide mixture at pH 2.0. The inset in (b) shows the CID spectrum of m/z 746.