
FIG. 3.
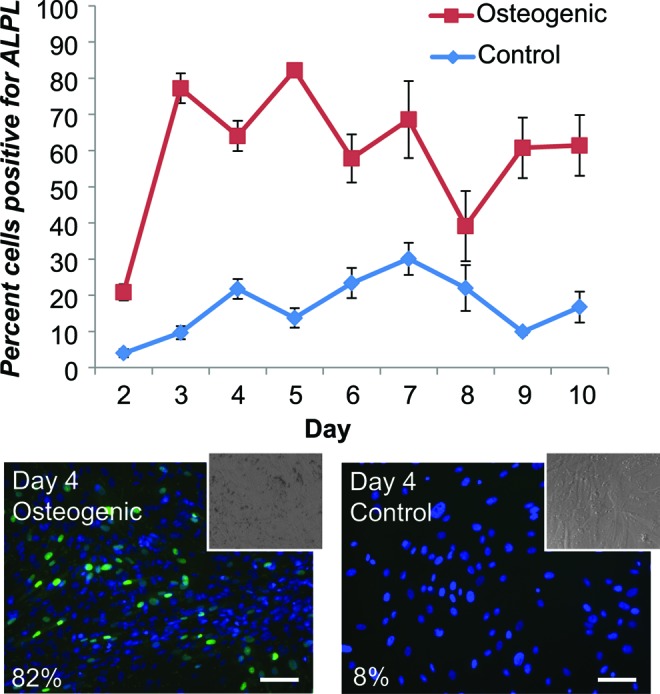
Percentage of ASCs expressing ALPL, measured daily from days 2–10. Higher percentages indicate days when most of the cells in a sample displayed positive signals for ALPL. These values can also be used as a measure of stem cell differentiation capacity, as positively differentiating cells should express osteogenic genes to a greater degree than nondifferentiating cells. The expression percentages cited earlier reflect the expected gene expression profiles for differentiating and control ASCs. Control populations show a higher-than-expected ALPL signal, although still significantly lower than the differentiated populations (p<0.0001). Representative images for osteogenic and control samples on day 4 are shown along with their calculated percentage expression (insets, brightfield images of same sample). Data collected from two iterations of the 10-day experiment (n=8). Mean±standard error. Color levels enhanced for presentation purposes. Scale bars: 100 μm. ASCs, adipose-derived stem cells. Color images available online at www.liebertpub.com/tea