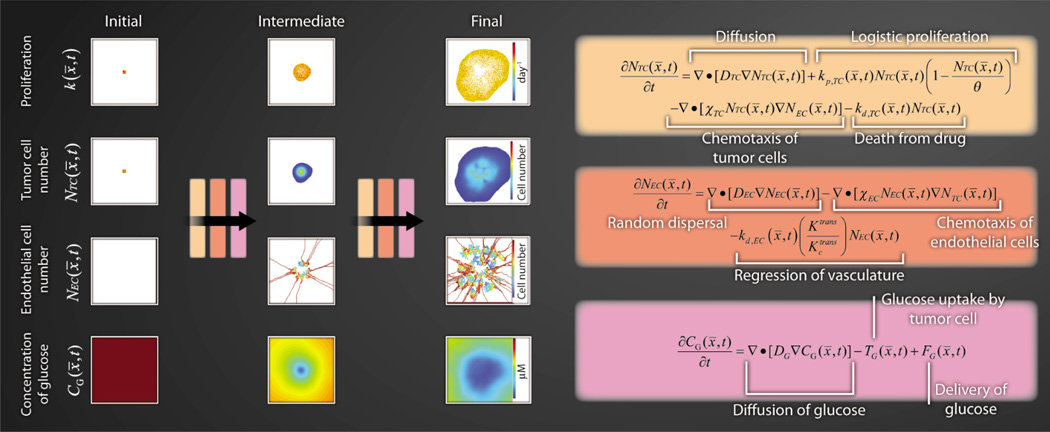
Fig. 3. Multimodal outputs to describe tumor and vessel dynamics.
Multimodal (PET and MRI), multiparametric imaging data (estimates of glucose utilization, tumor cellularity, vascularity, perfusion, and tissue volume fractions) could be used to initialize and constrain a coupled set of partial-differential equations describing tumor cell proliferation, angiogenesis, and glucose utilization. The far left column represents the type of data that would be available from routine DW-MRI (k, NTC), DCE-MRI (NEC), and FDG-PET imaging (CG). These data can then be input into the equations provided to predict distributions of these parameters at future time points (intermediate and final outcomes). As with Figs. 1 and 2, the model outcomes can be directly compared with experimental data.

