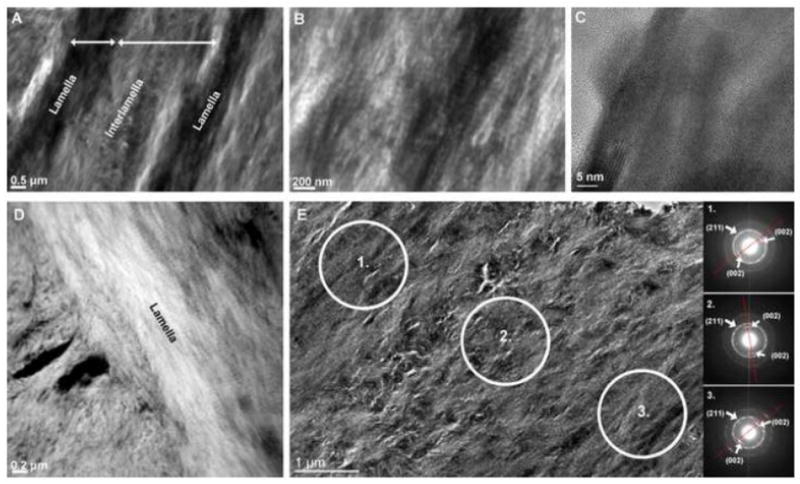
Figure 6. Complementary TEM data illustrated electron dense lamellar regions with visible collagen and possibly intrafibrillar mineral.

Conventional TEM micrographs illustrate interlamellae and lamellae regions of lamellar bone (A) with visible collagen banding (B) and high resolution lattice fringes confirm crystallinity of the apatite mineral phase (C). High angle annular dark field STEM images (D) give rise to a slight compositional contrast of lamella and interlamellae regions. Selected area diffraction patterns (E) also highlight the varying and preferred texture of crystals within these regions. The preferred orientation of the c-axis of the crystal, corresponding to the (002) direction, is indicated by red lines on the diffraction pattern.
