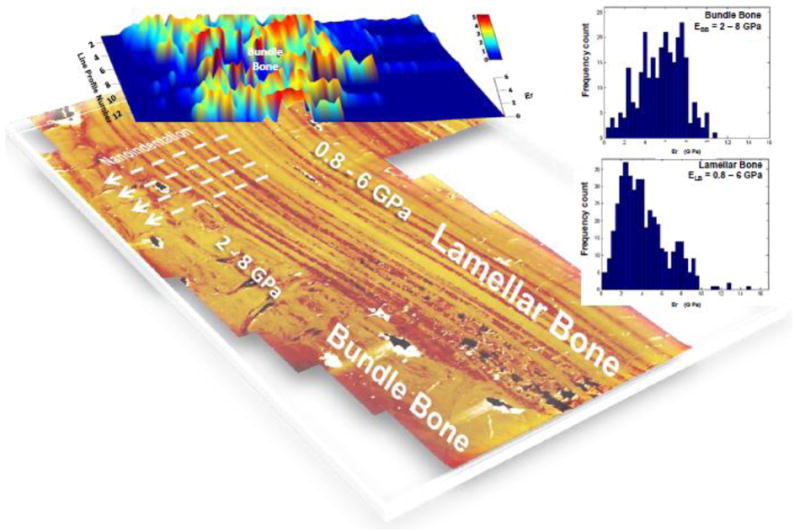
Figure 8. Heterogeneity in elastic modulus within and across bundle bone and lamellar bone.

Three-dimensional plot of reduced elastic modulus (Er) overlaid on an AFM image illustrating the location of site-specific nanoindentation measurements. As illustrated via frequency plots, bundle bone demonstrated higher reduced elastic modulus values ranging from 2-8 GPa compared to 0.8-6 GPa for lamellar bone. All values are from hydrated tissues. LB: Lamellar bone, BB: Bundle bone
