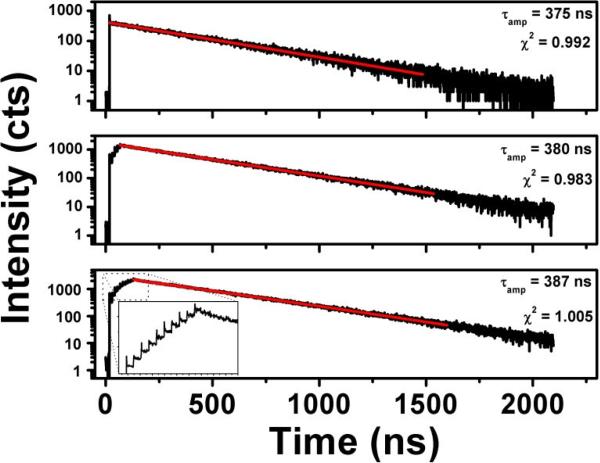
Figure 5.
Intensity decays of a Ru dye solution with 1-pulse (top), 5-pulse (middle), and 10-pulse (bottom) excitation schemes. No appreciable change is seen in the lifetime fittings. The time scale of this figure is set very large in order to accommodate the ~380 ns liftime of Ru, however, the inset in the bottom graph shows a magnified view of the excited state pumping that occurs with the 10-pulse excitation. Both the time scales and intensity scales of the inset are linear.

