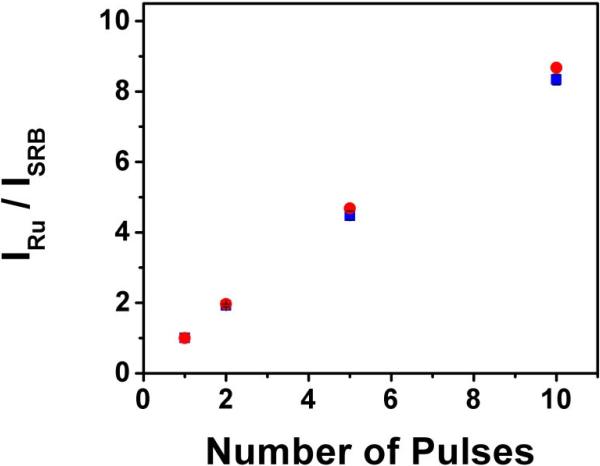
Figure 6.
Increasing signal to background intensity with multi-pulse excitation. The blue squares represent experimental data collected from free dye of Ru and, separately, SRB. Each data collection was normalized and the ratio was then calculated. The red circles represent the modeled data.Error bars are shown on the experimental data to portray the standard deviation between 3 collections, which was always less than 2%.

