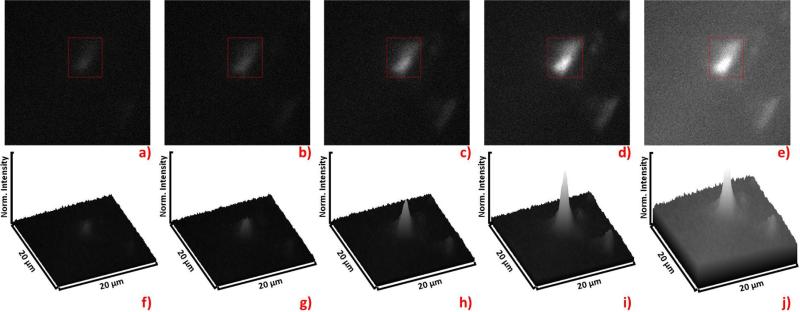
Figure 7.
Fluorescence imaging with multiple pulse excitation. Images a) through d) depict a bead loaded with the long-lived Ru on a background of short-lived SRB, and the intensity scales are normalized to the full intensity span of d). The image a) shows the result of 1-pulse excitation, b) shows 2-pulse excitation, c) shows 5-pulse excitation, and d) shows 10-pulse excitation. The image in e) depicts 1-pulse excitation, but the average laser power has been increased to the average laser power of the pulse train involving 10-pulse bursts in d). The Signal to background ratio in e) differs by 3% from that of a). Each surface plot, f) through j), corresponds to the image, a) through e) above it. The red boxes in images a) through d) indicate the area from which the data in Figure 8 were collected.

