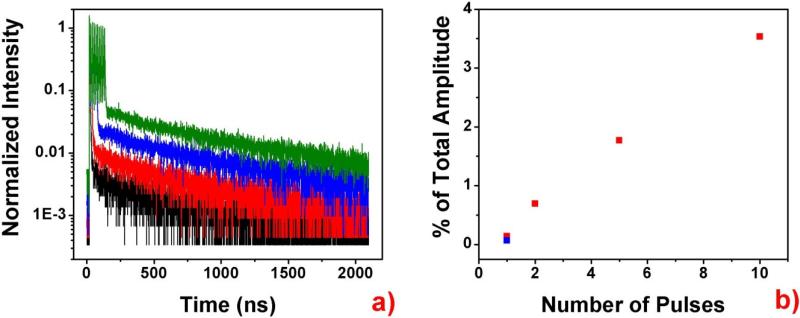
Figure 8.
a) Fluorescence intensity decays collected from the area indicated in the red boxes in Figure 7a through 7d. The black line shows 1 pulse excitation, red shows 2-pulse excitation, blue shows 5-pulse excitation, and green shows 10-pulse excitation. All data are normalized to the last pulse in the burst. b) To each of the decay curves, a two-component exponential decay fitting was performed with the lifetimes of the two components fixed at 1.65 ns (SRB background) and 375 ns (bead labeled with Ru). The amplitude of the long-lived component is shown as the percentage of the overall amplitude in the pane on the right. The blue square in this pane shows percentage computed for the high intensity, 1-pulse excitation depicted in Figure 7d, whose decay is not shown in a) in order to increase clarity.

