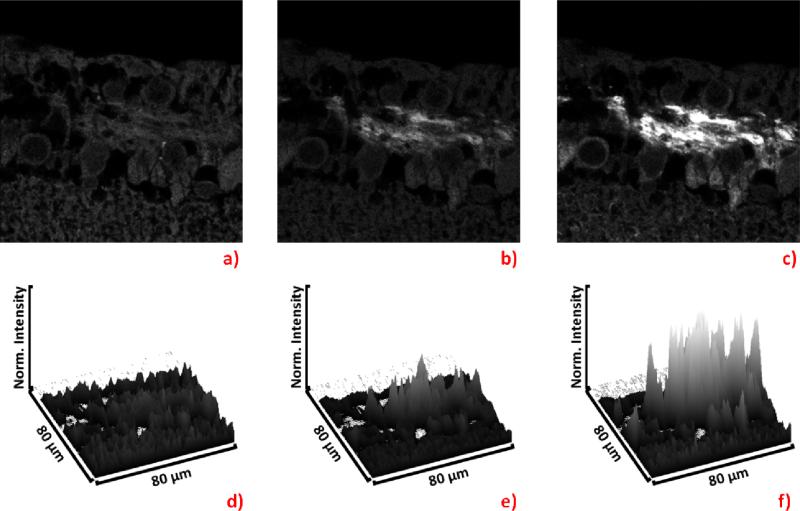
Figure 9.
Fluorescence intensity images of Ru-labeled IgG detecting the β-tubulin III in the rat retinal tissue. The image a) shows the result of 1-pulse excitation, b) shows 5-pulse excitation, c) shows 20-pulse excitation. Each surface plot, d) through f), corresponds to the image, a) through c) above it.

